The Metastasizing Cancer Menace, as Seen in Vermont's Death Certificate Data
Collectively, cancer-related deaths are ominously rising in 2021 and 2022 well above pre-pandemic levels, far more than in 2020
Vermont's Cancer Creep
One of the more frightening and potentially cataclysmic public health disasters brought on by the covid vaccines is the dysregulation of immunological mechanisms critical to suppressing cancerous cells. There is likewise a plausible mechanistic basis to suspect that the covid vaccines themselves also promote the development of cancerous cells.
On the other hand, even before the vaccines were rolled out it was understood that the lockdown policies would probably lead to an increase in cancers as a result of various disruptions to the provision of healthcare or changes in people’s behavior with deleterious health impacts.
Excess cancer mortality is therefore a critical topic to flesh out. That being said, the goal of this article is only to establish what has happened in regards to cancer in Vermont, and not to attempt to adjudicate the “why”. As we shall see, sorting out the cancer trends, especially for a state with such a small population, is very messy and does not yield robustly definitive conclusions. In order to credibly and reliably apportion blame for the cancer situation - to the extent that one exists - we need data from additional states. If only there was a nice, big state that had a dataset sufficiently large & diverse to draw firm conclusions. . . . .
Methodology
Although this is not a formal study, I want to convey as clearly as possible what the raw death certificate data is, what it shows when organized into different groupings or trends, and what can and cannot be logically deduced or extrapolated from the data.
Identifying Cancer Conditions
The biggest hurdle to sorting out the cancer situation is isolating all of the cancer conditions. Unfortunately, since Vermont does not assign ICD codes, this must be done by manually searching for text descriptions of cancer conditions.
I curated the list of cancer conditions that I used as follows:
Created a new column which combined Causes of Death A, B, C, D, & Other into a single column, which is what is always being used for the purpose of searching CoD conditions.
Isolated every death certificate mentioning a condition that contained the text “oma ” (with the space at the end).
Isolated from the remaining death certificates any that contained at least one of the following text strings (I asked around for terms to use). The ‘*’ before and after each text string is a formula search parameter to search anywhere within the text of a cell for the characters inbetween the **’s. I used shortened versions when I was confident that it was specific enough to avoid sucking in other unrelated words to account for potential misspellings (I have found a few instances of misspelled words, such as ‘hemotoma’ instead of ‘hematoma’):
“*leuk*”
“*malign*”
“*neoplas*”
“*neuroendo*”
“*cancer*”
“*tumor*”
“*metast*”
“*B-Cell*” / “*B Cell*” (I replaced all instances of “B Cell” with “B-Cell” to concatenate them into a single searchable term)
From isolated death certificates, all of the distinct conditions ending in “oma ” were identified
For the non-cancer “oma ”s, the “oma ” was replaced with “om@ ”; except for “ coma ” which was replaced with “ c0ma ”. Non-cancer conditions were identified using Google & based upon the description contained in the death certificate.
(Random frustrating anecdote: The size of the spreadsheet (about 60-70mb depending on which one) causes Excel to crash frequently on my laptop. One of those crashes undid the substitution of “om@” for “oma” for hematomas, something that I unfortunately didn’t immediately realize after restoring the file, and I disseminated a chart with these slightly higher numbers across the board to a few people by accident as a result.)
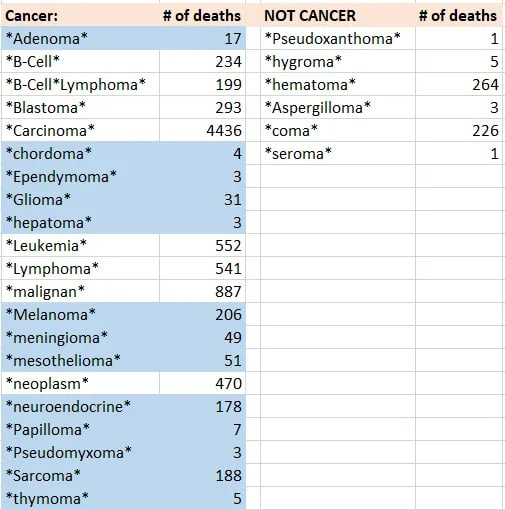
Since for most of the individual cancer conditions the total number of deaths is too few to use individually, I combined them into a single category by appending a ‘()’ after the “oma ” and using the ‘()’ as the search term to tally them for the graphs. These combined conditions are highlighted in blue in the list below.
A new column was created to prevent double-counting deaths that mentioned more than one cancer condition, with a value binary of either 1 if it contained at least one of the cancer conditions, and 0 if it did not. This is what I used to tally the combined total number of deaths that included a cancer conditions among the CoD’s.
The following was the resulting list of cancer conditions. The # of deaths here refers to the total number for all years 2015-October 2022.
It is definitely possible that I missed one or more cancer conditions. However, I doubt that any missed conditions would be numerous enough to make a difference for any of the analyses below (at least I hope this is the case).
As we will see, the trends within specific types of cancer conditions or terms are wildly inconsistent, which poses a significant confounding variable to straightforward interpretations of the cancer data.
The Cancer Situation in Vermont
The following charts depict the following basic statistics:
The number of death certificates that mention cancer conditions
How often different cancer conditions are mentioned in death certificates (not the same thing)
Various demographic breakdowns of the above two items
One final note: Read *ALL* of the chart labels!!
No two charts are exactly identical, even if they may appear to be at first glance. All parameters that apply to the entire chart are specified in the title at the top - meaning that any designation included in the title applies to everything. All other specifications are described on the bottom underneath the bars. The default for charts is they cover all cancer conditions for the entire 12-month calendar year for the specified group underneath the bars in any particular graph.
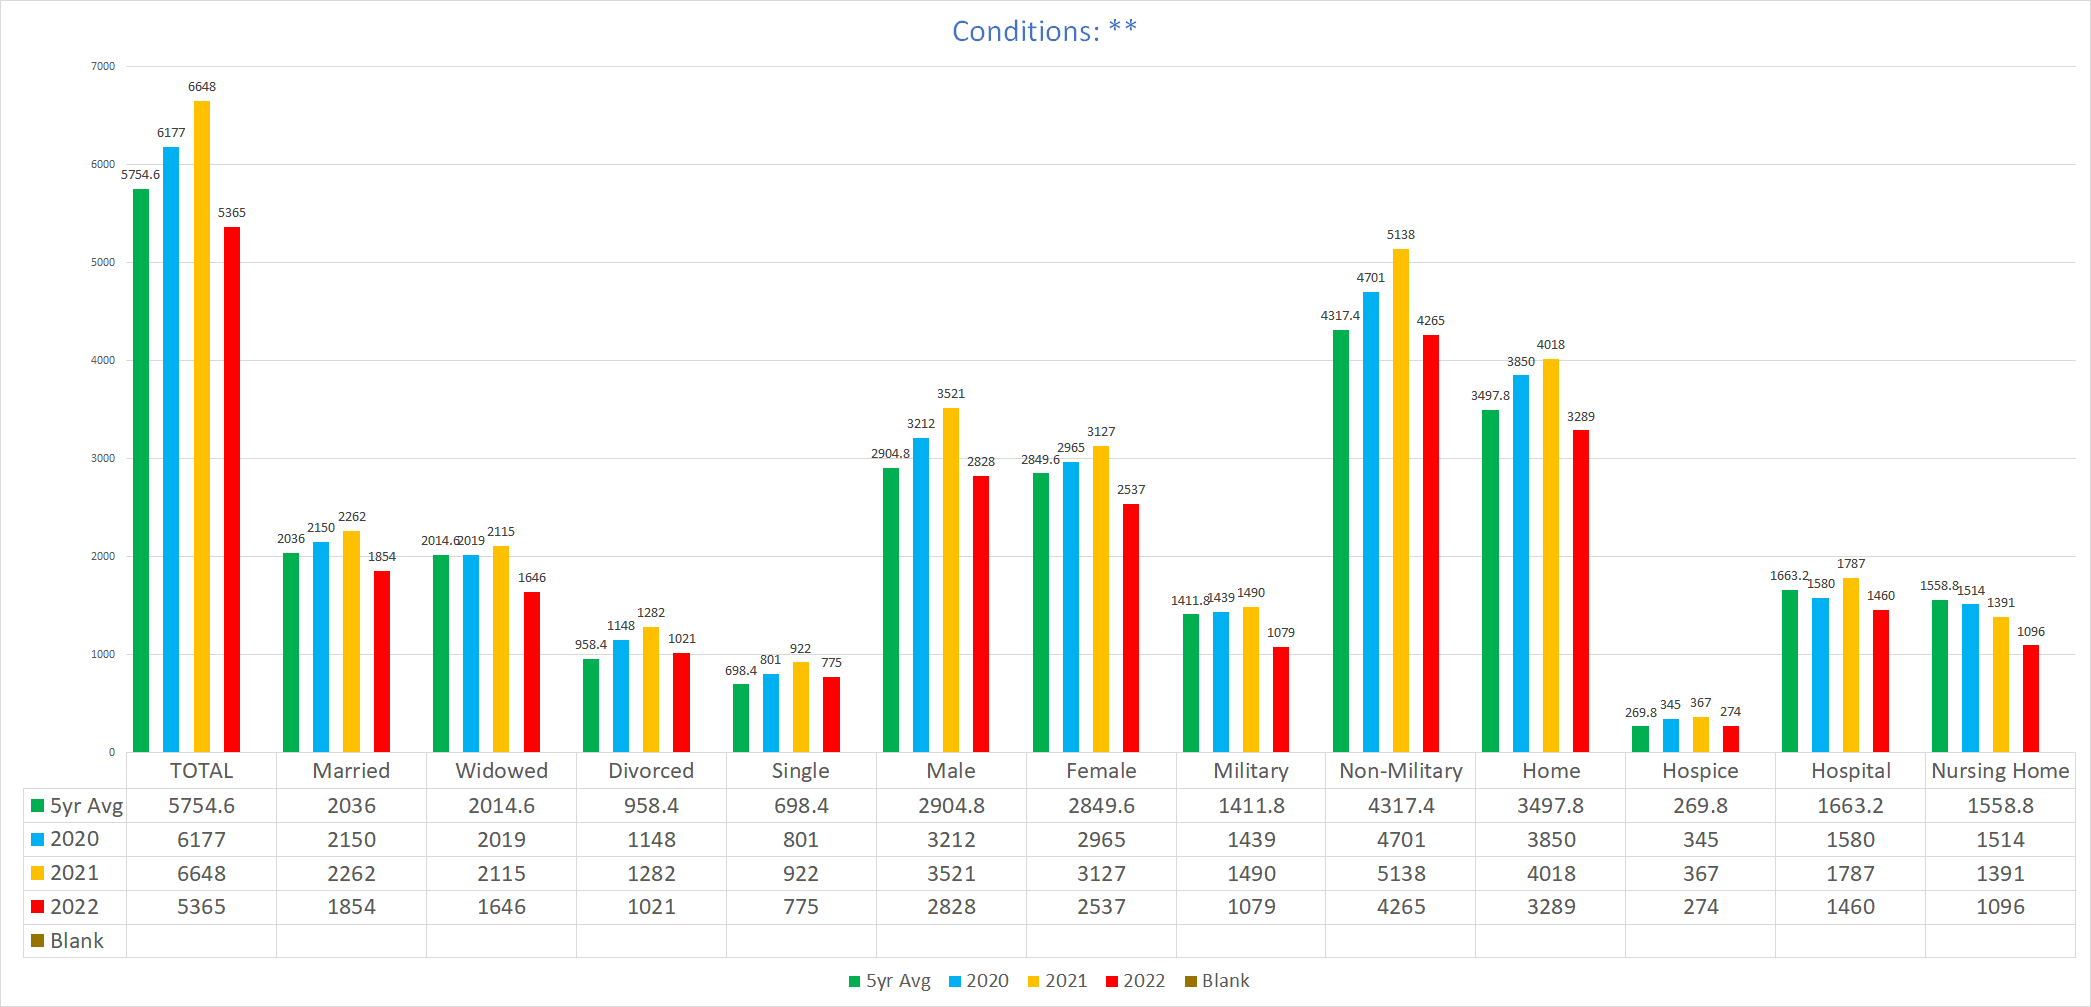
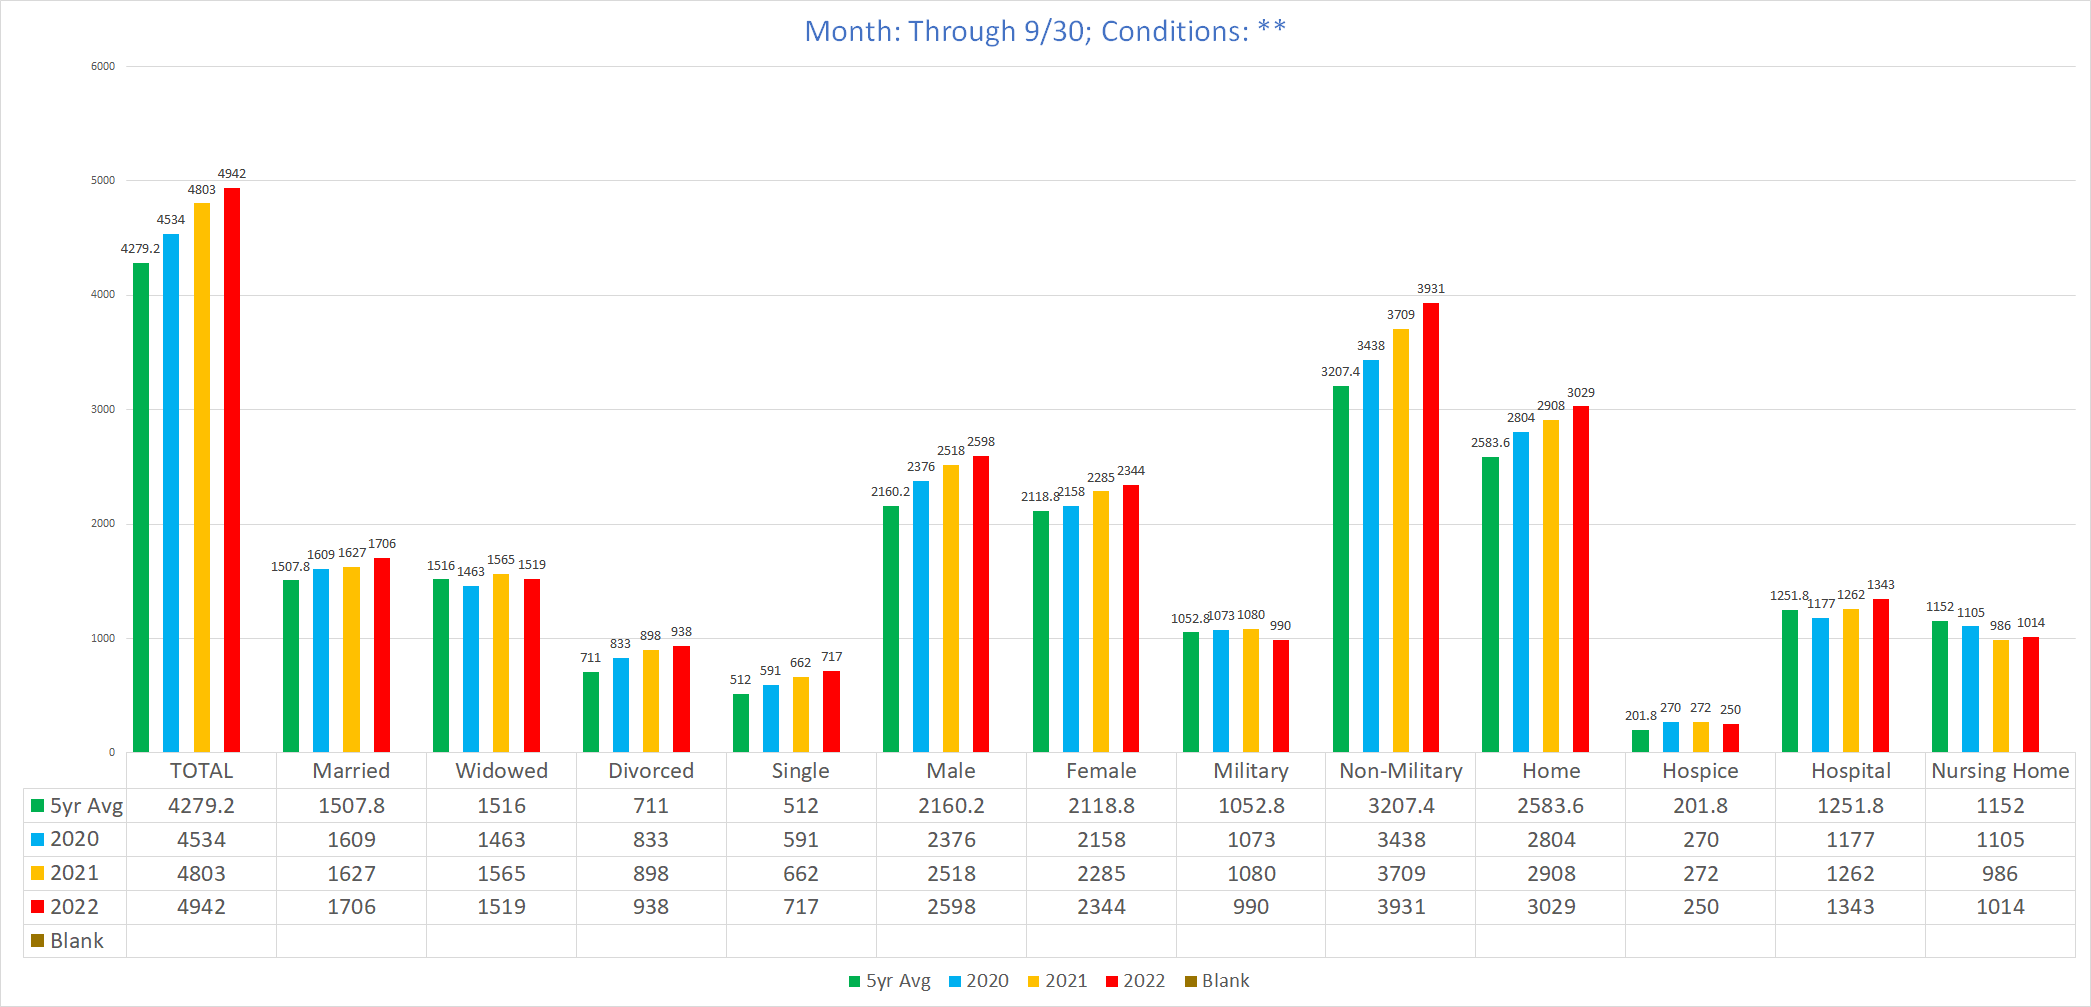
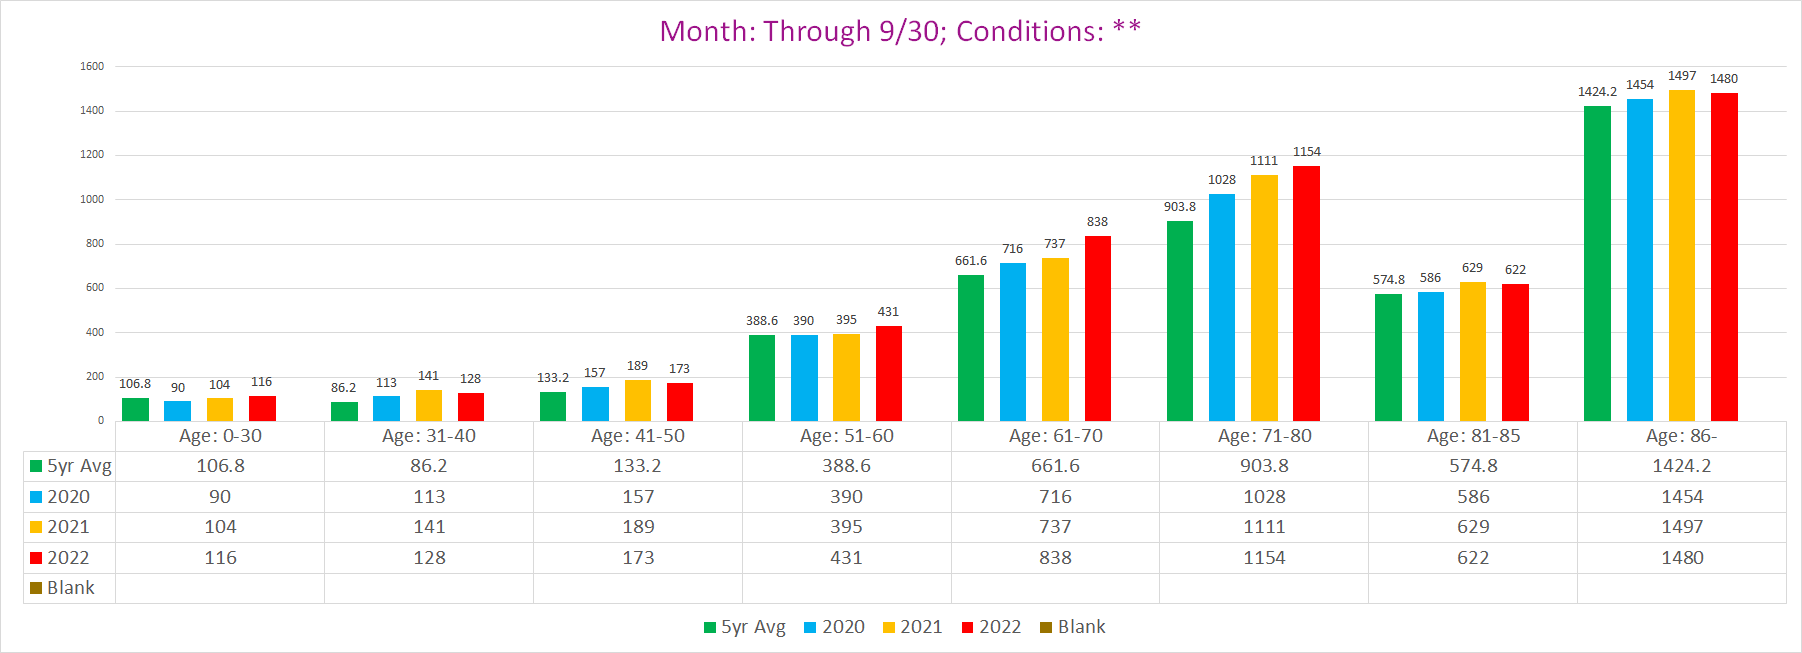
Reference Charts - All Cause Mortality for everyone:
Before showing the cancer conditions, here is all-cause mortality so you can see what the same breakdowns look like for deaths in general.
Full calendar year:
Through 9/30 each year:
Cancers
Group #1 - Entire calendar year
This is the broadest overarching view of the cancer situation. Two things are immediately obvious:
The total number of deaths involving a cancer condition rises each pandemic year - 2020 is higher than the 5yr average of 2015-2019 & 2021 is higher than 2020 (and as we shall see, 2022 is on pace to eclipse 2021).
When you drill down to the specific cancers, it is not a stable picture of rising cancers, rather in each year some are up, some are down, and some are about the same. One possible reason for this that must be considered is that subjective administrative decision making is a significant determinant for CoD’s listed on death certificates, for instance it is known that many if not most Medical Examiners are themselves error-prone and/or inconsistent when filling out death certificates.
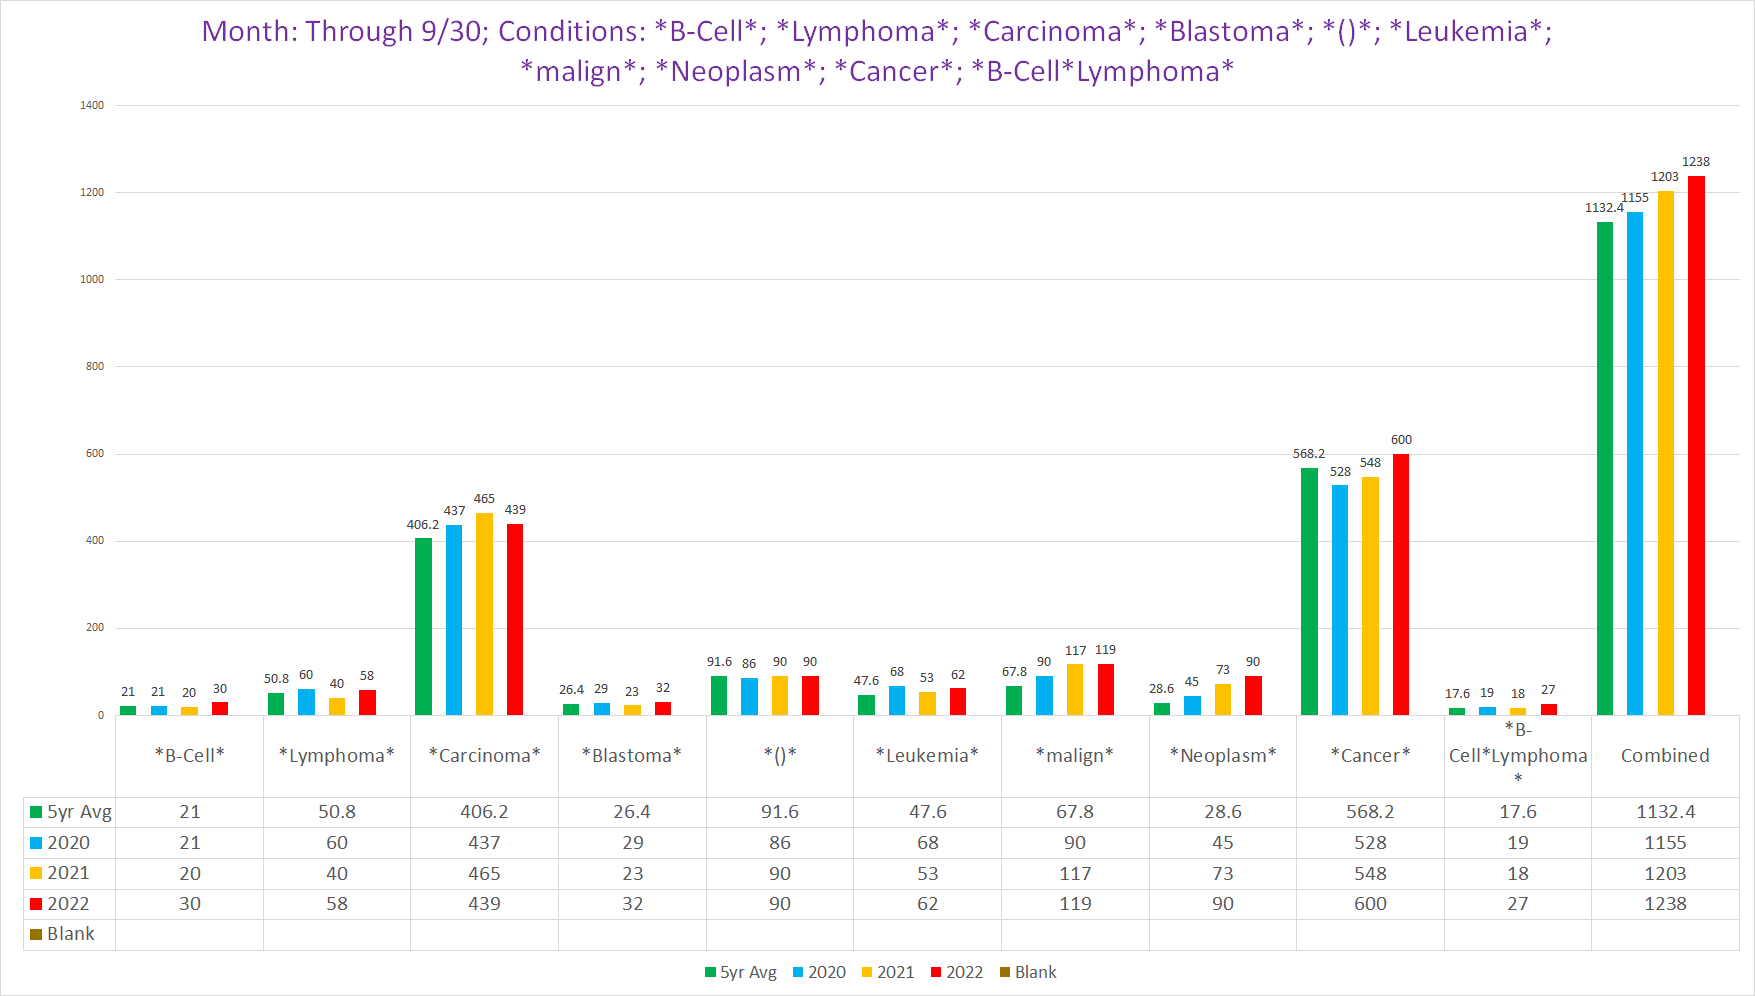
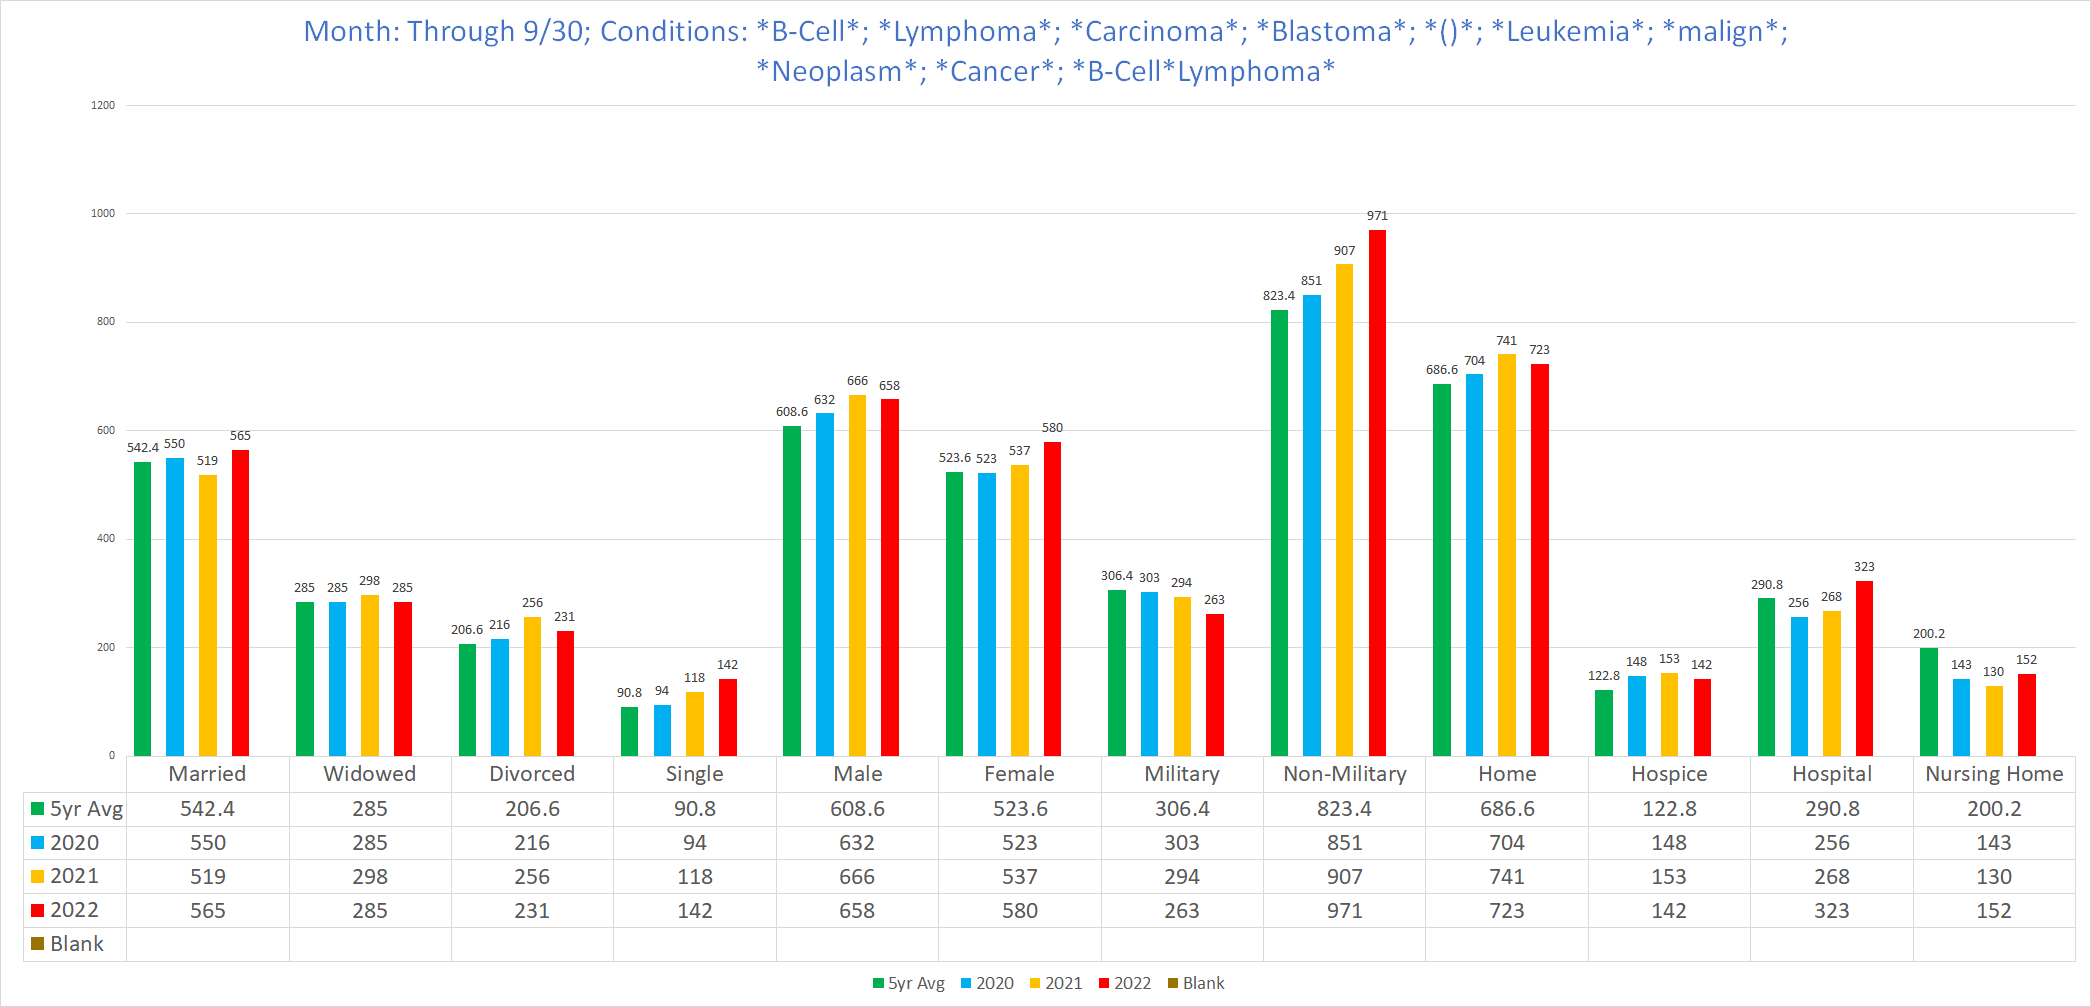
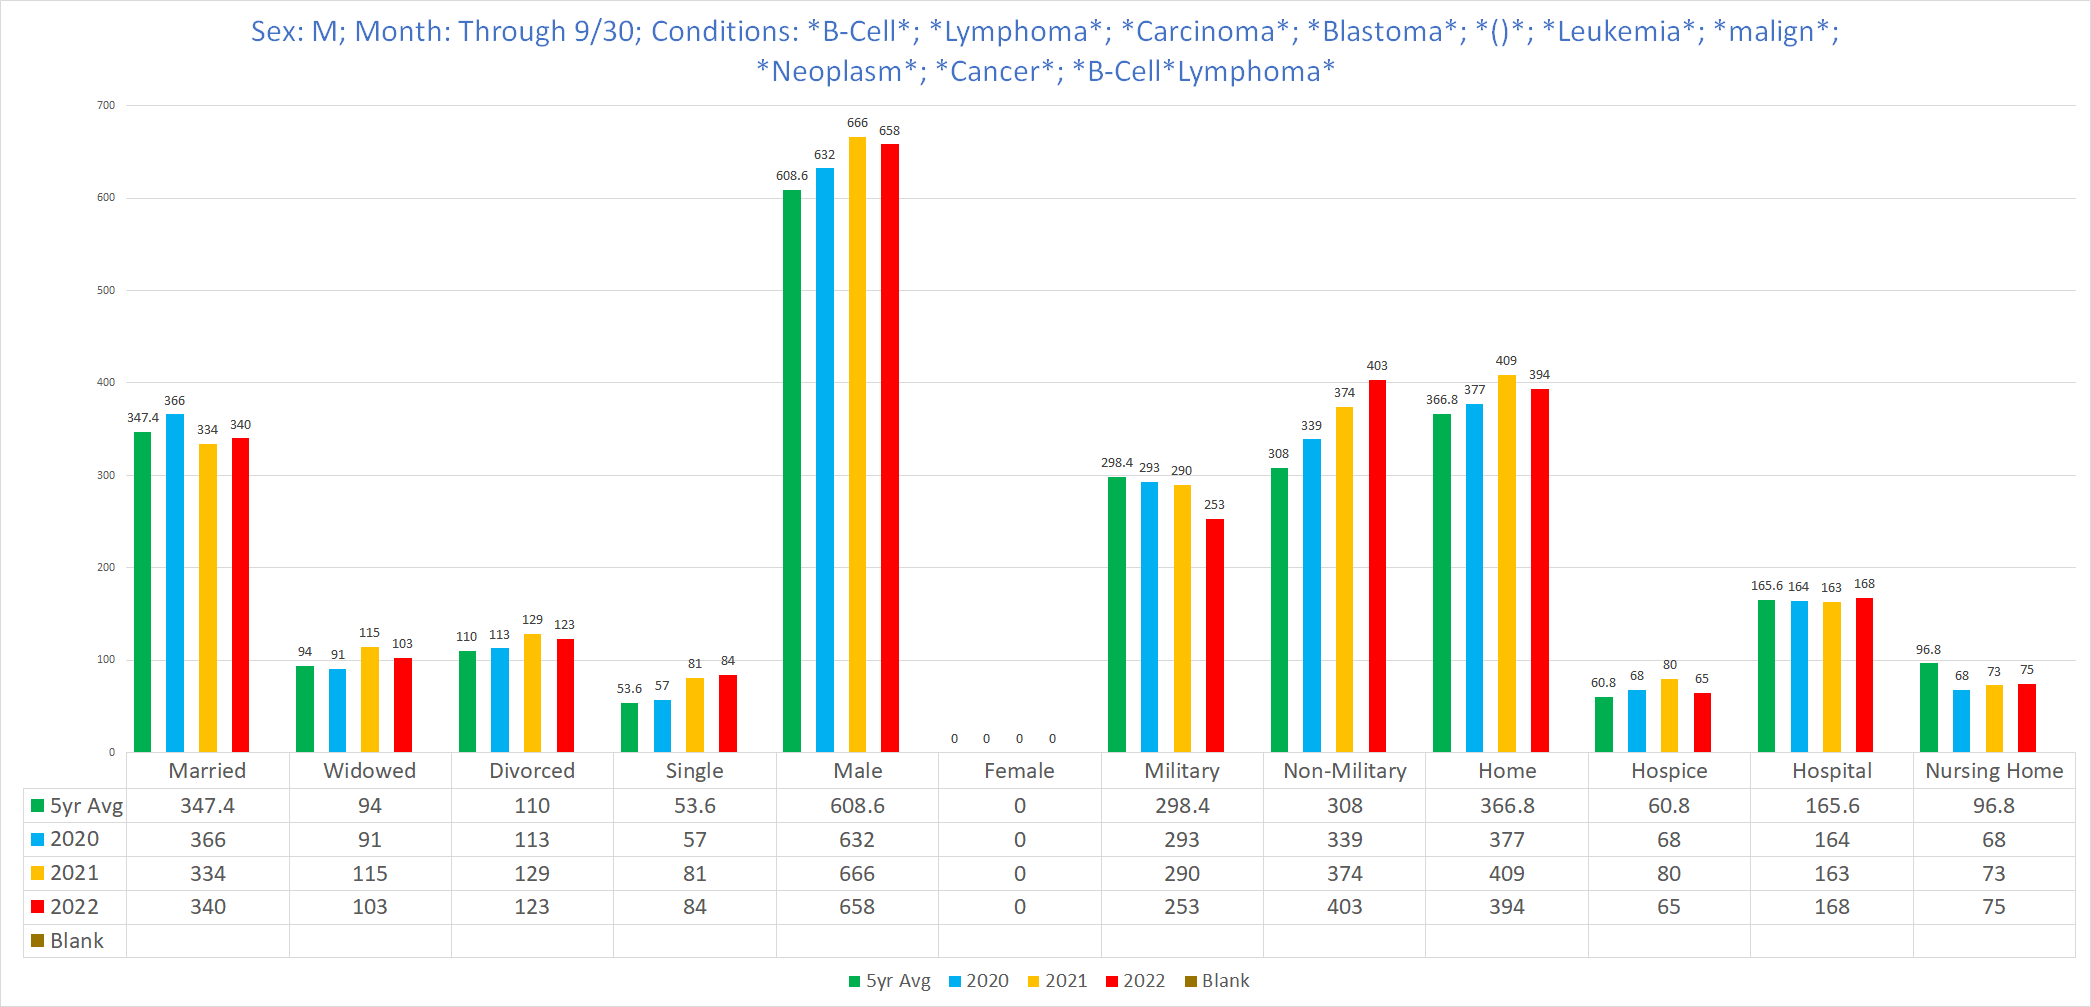
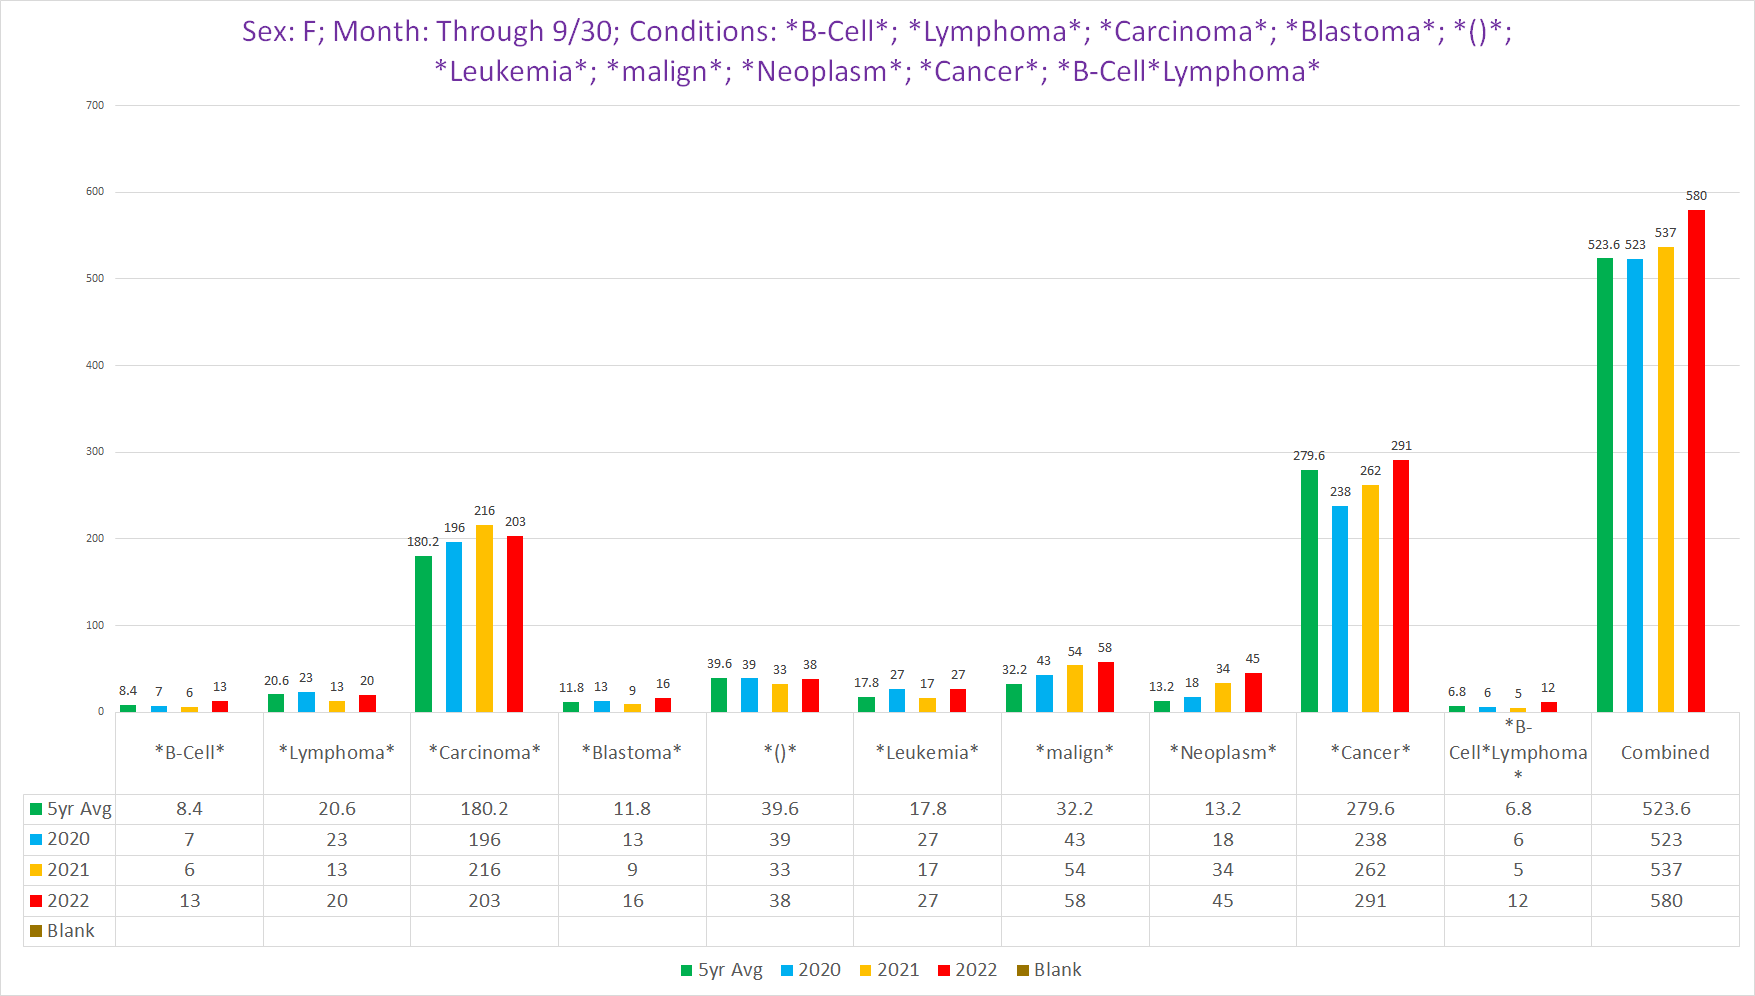
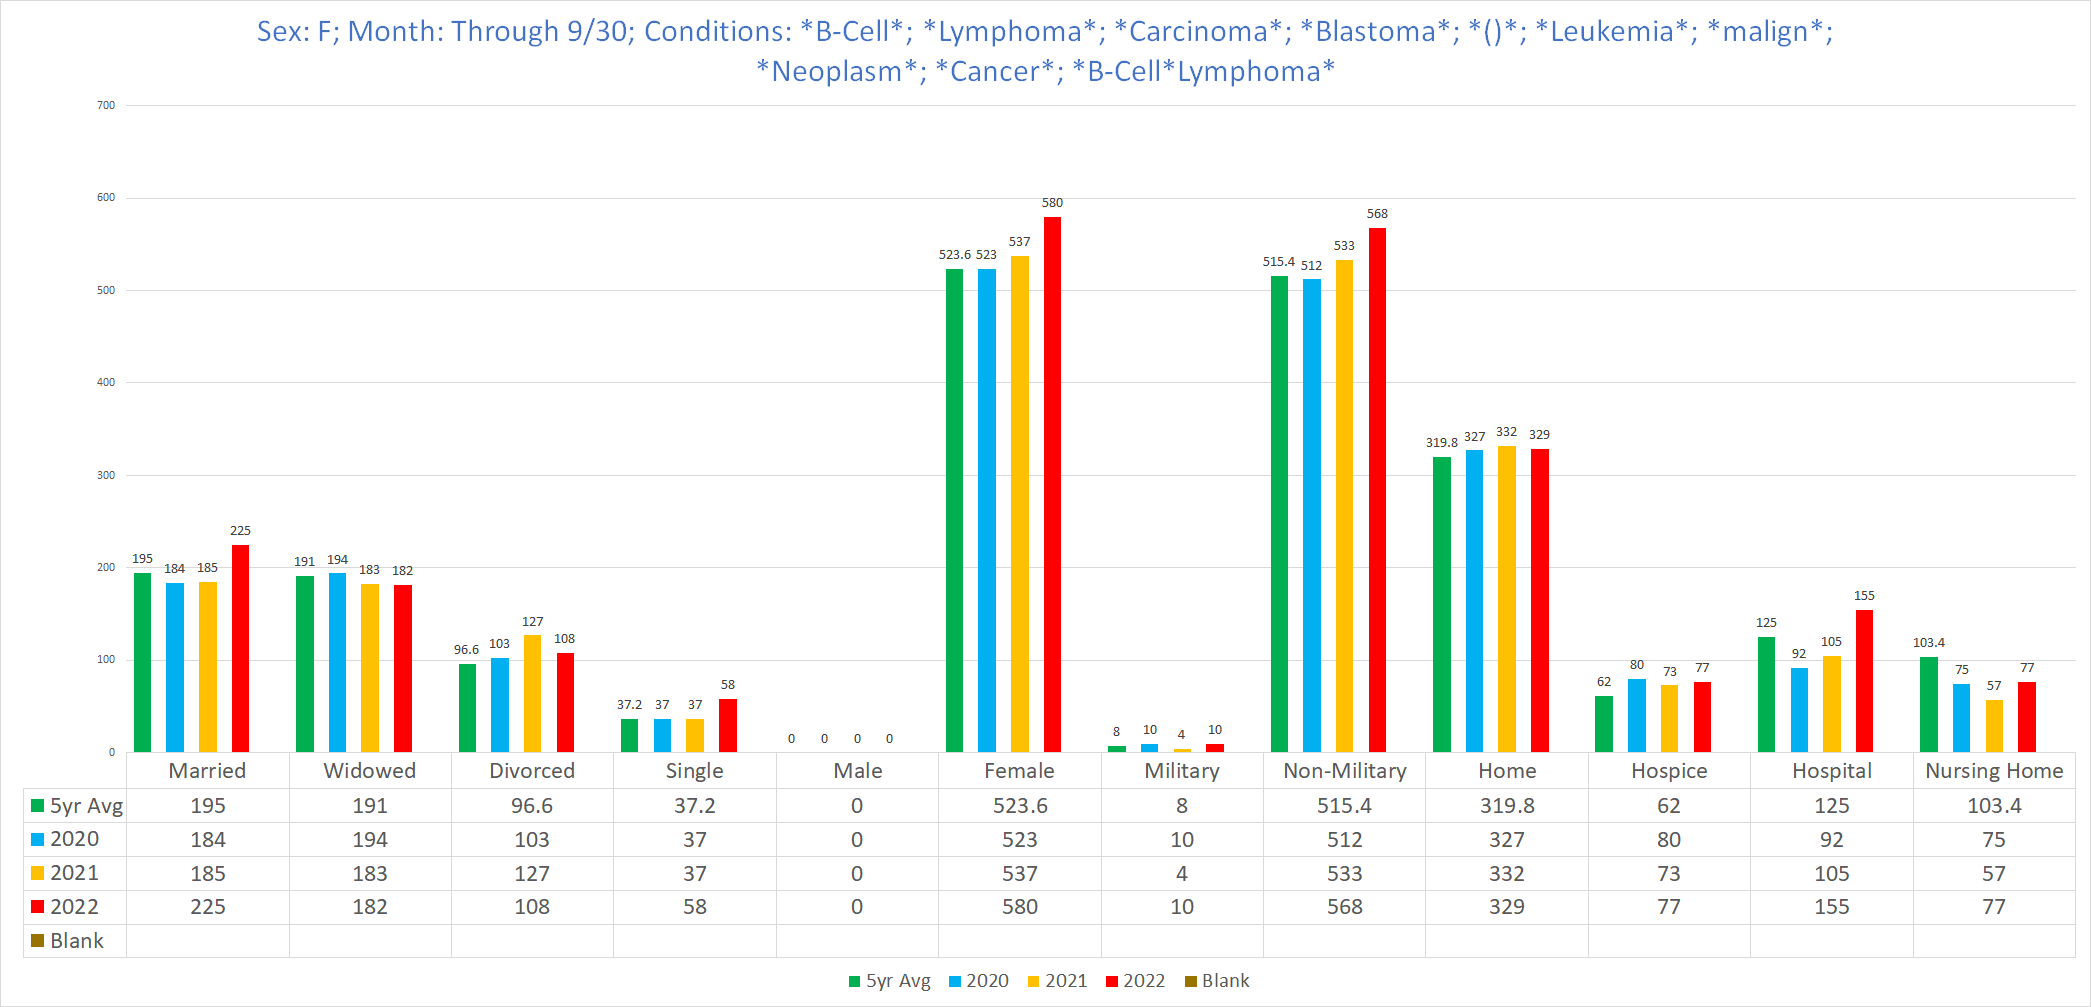
Group #2 - Through 9/30 each year
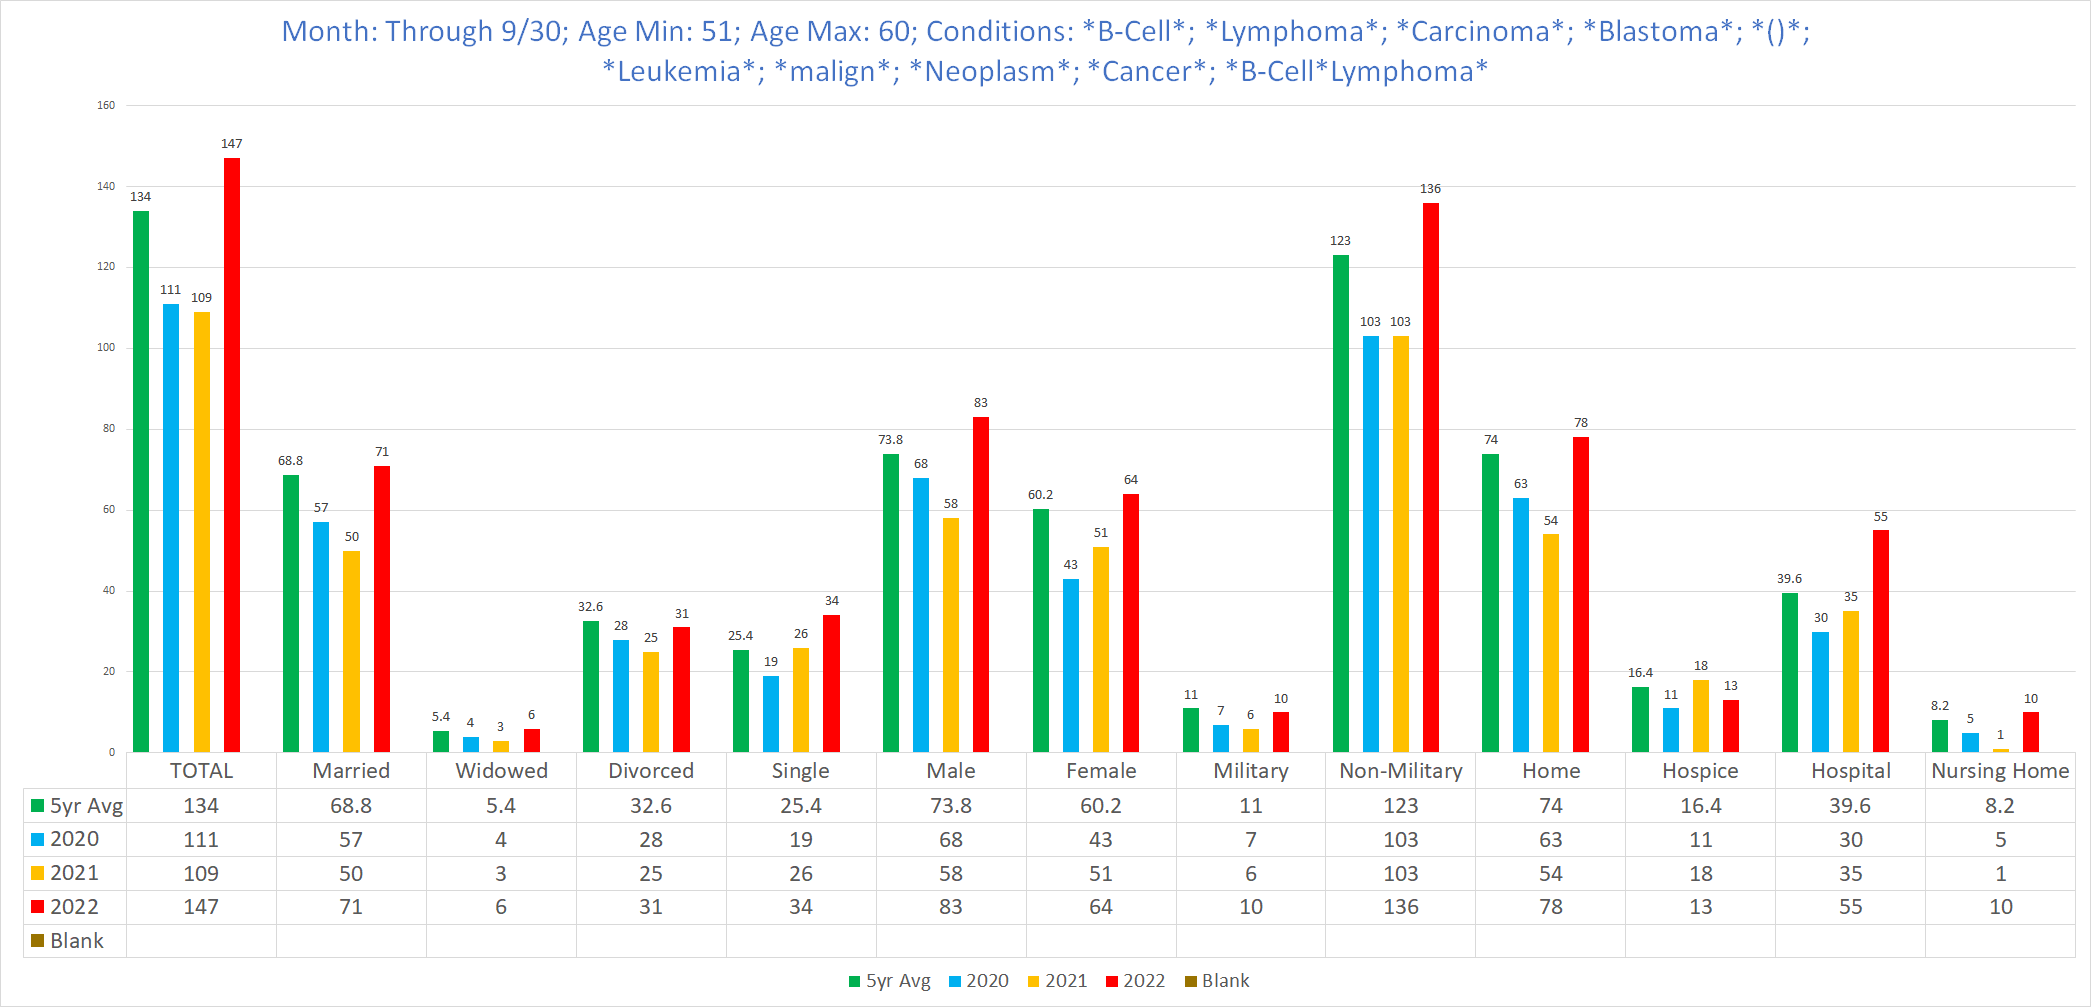
Using only the first 9 months is probably the most realistic snapshot of the ‘forest’ because it shows how 2022 compares to the previous years. As is readily apparent, 2022 is continuing the trend of excess cancer-related deaths.
It is important to remember that when there are consecutive years of excess deaths above the nominal ‘expected’ number of deaths, the true number of excess deaths is going to be increasingly higher than the difference between the topline numbers year to year, because of what is known as a ‘pull-forward’ effect.
The ‘pull-forward’ effect is essentially as follows: If there are excess cancer deaths in one year, this depletes the pool of people susceptible to dying from cancer for the next year (or few years depending on the magnitude & characteristics of the excess), because inevitably some or most of the excess deaths happen to people who were already susceptible to dying from cancer, meaning that there should be fewer cancer deaths than ‘normal’ the following year. Put differently, if the next year had the normal number of cancer deaths, that would in reality be excess cancer deaths because there are still people dying from cancer in year #2 who were not ‘supposed’ to (you can ask your local actuary about this).
Therefore, the fact that 2021 - and even more for 2022 - saw excess cancer deaths following excess deaths in 2020 [& 2021] means that the degree of excess is probably more than what would appear to be the case superficially.
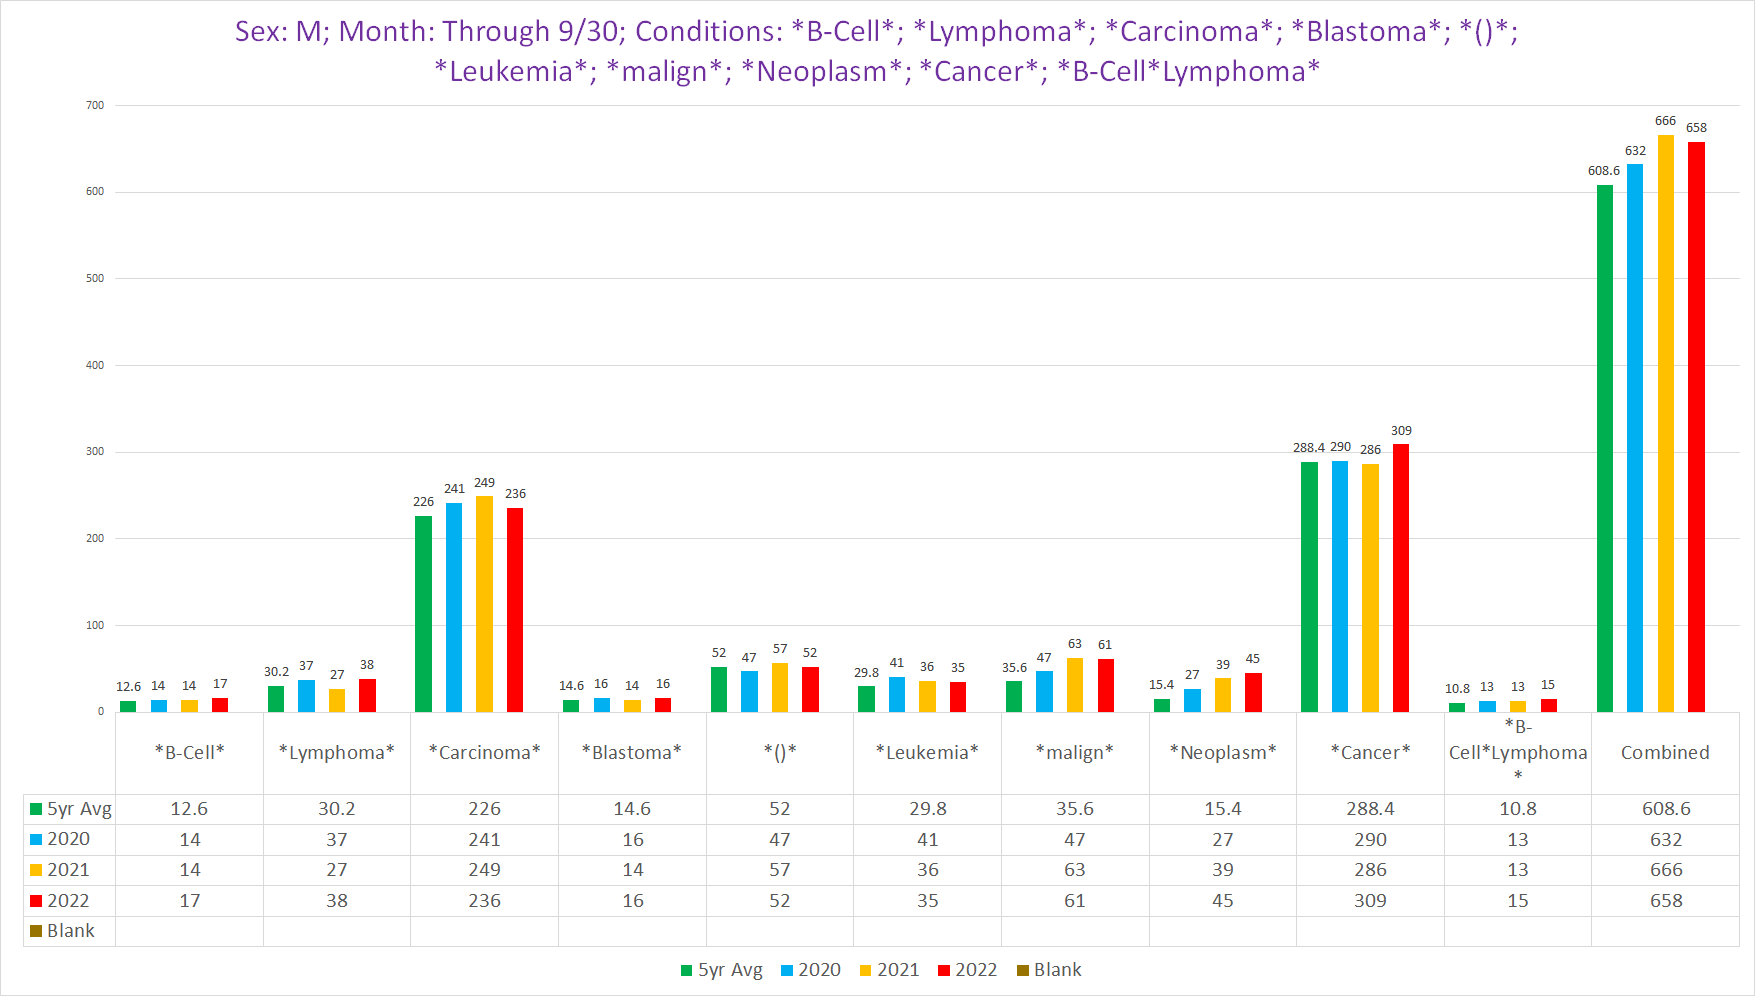
Group #3: Men, Through 9/30
Group #4: Women, Through 9/30
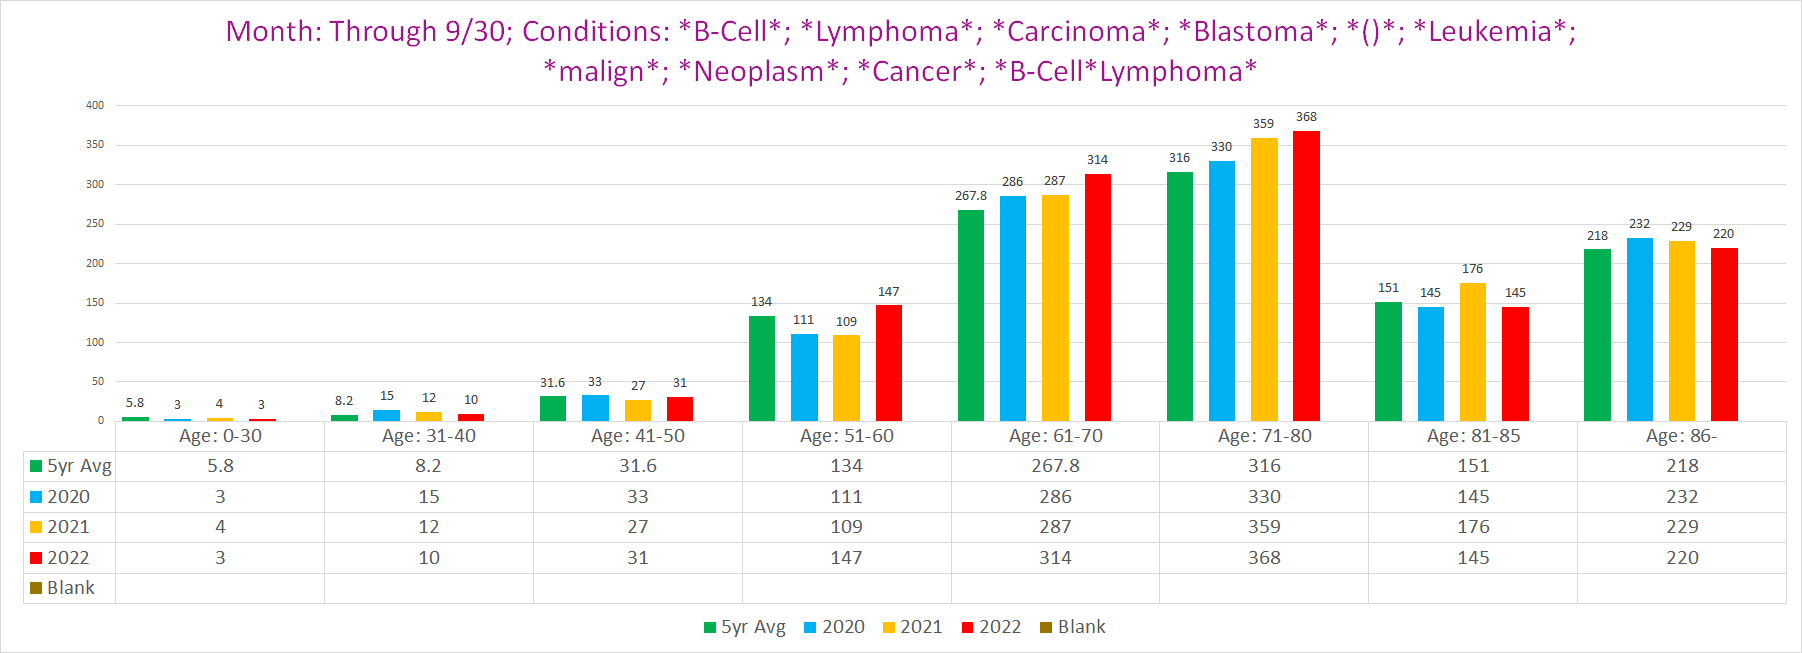
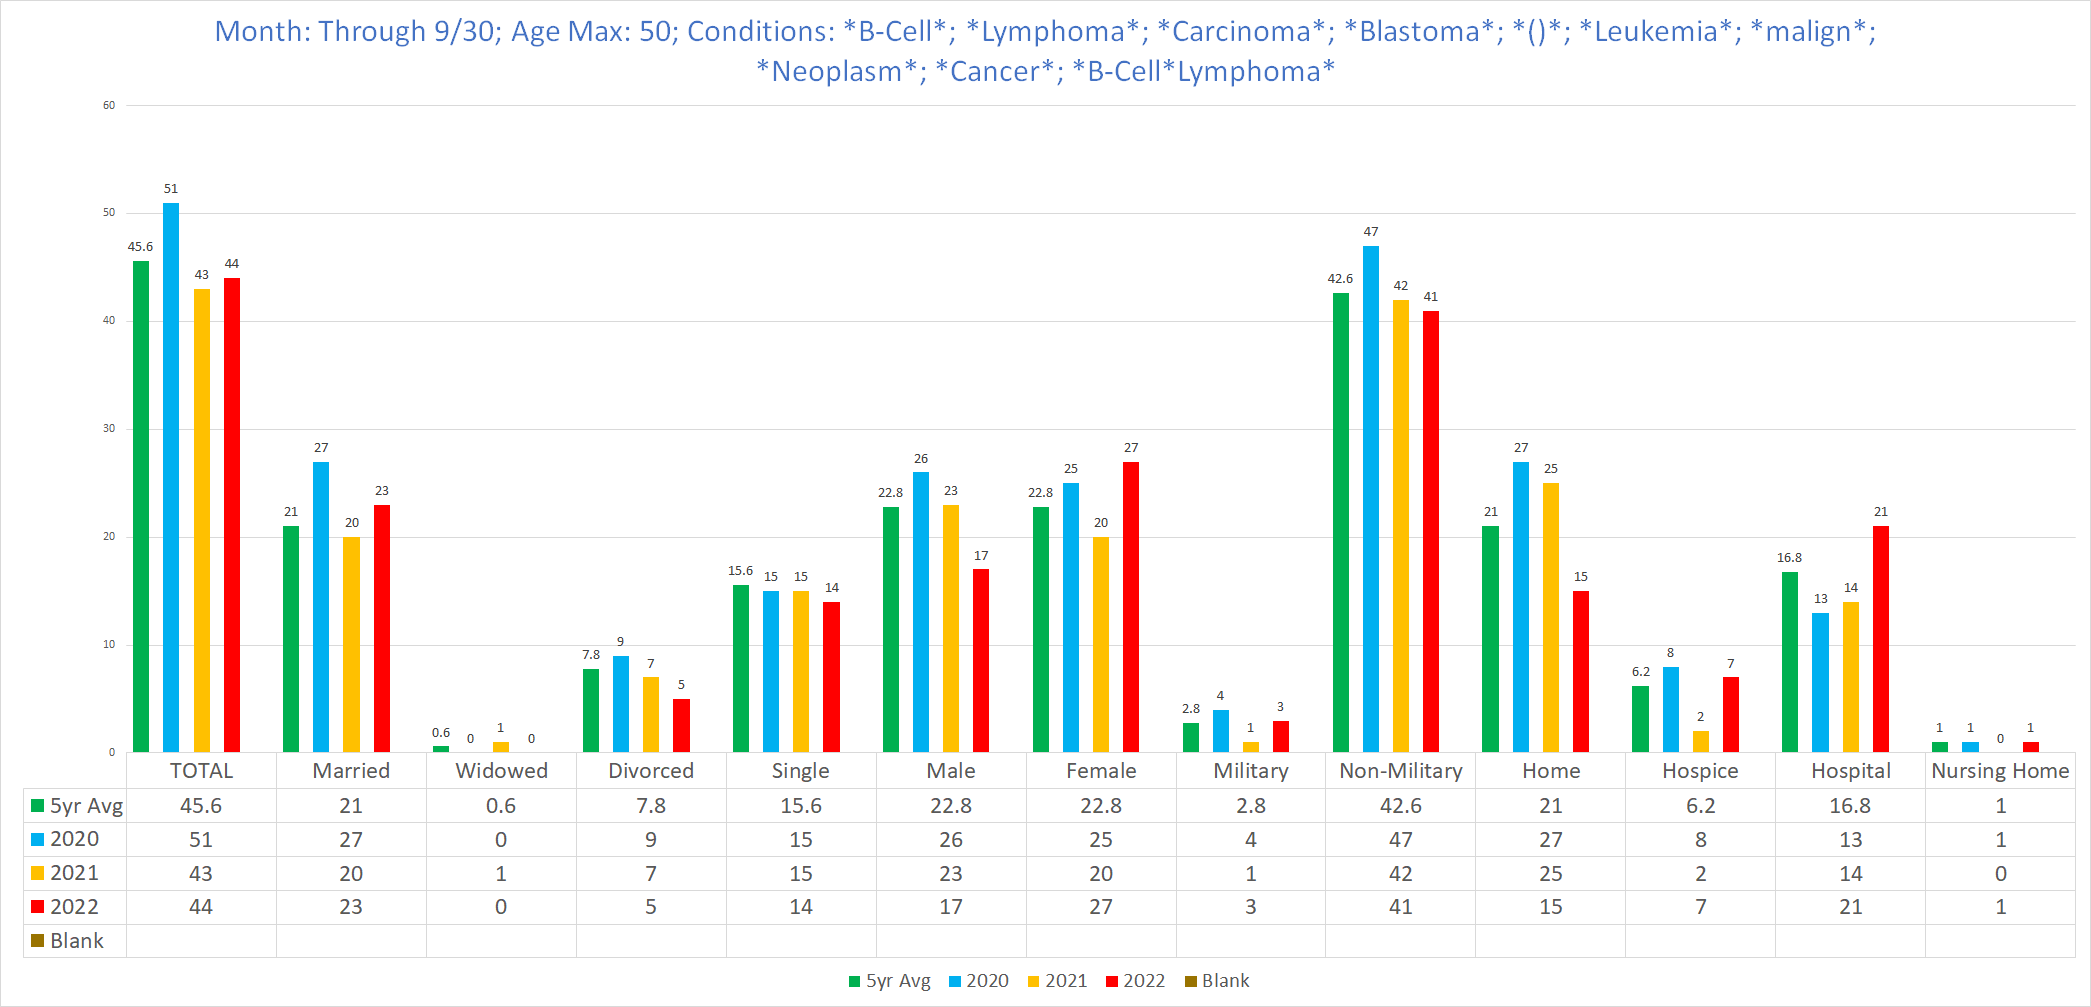
Group #5: Different Age Cohorts, Through 9/30
Age 0-50:
Age 51-60:
Age 61-70:
Age 71-80:
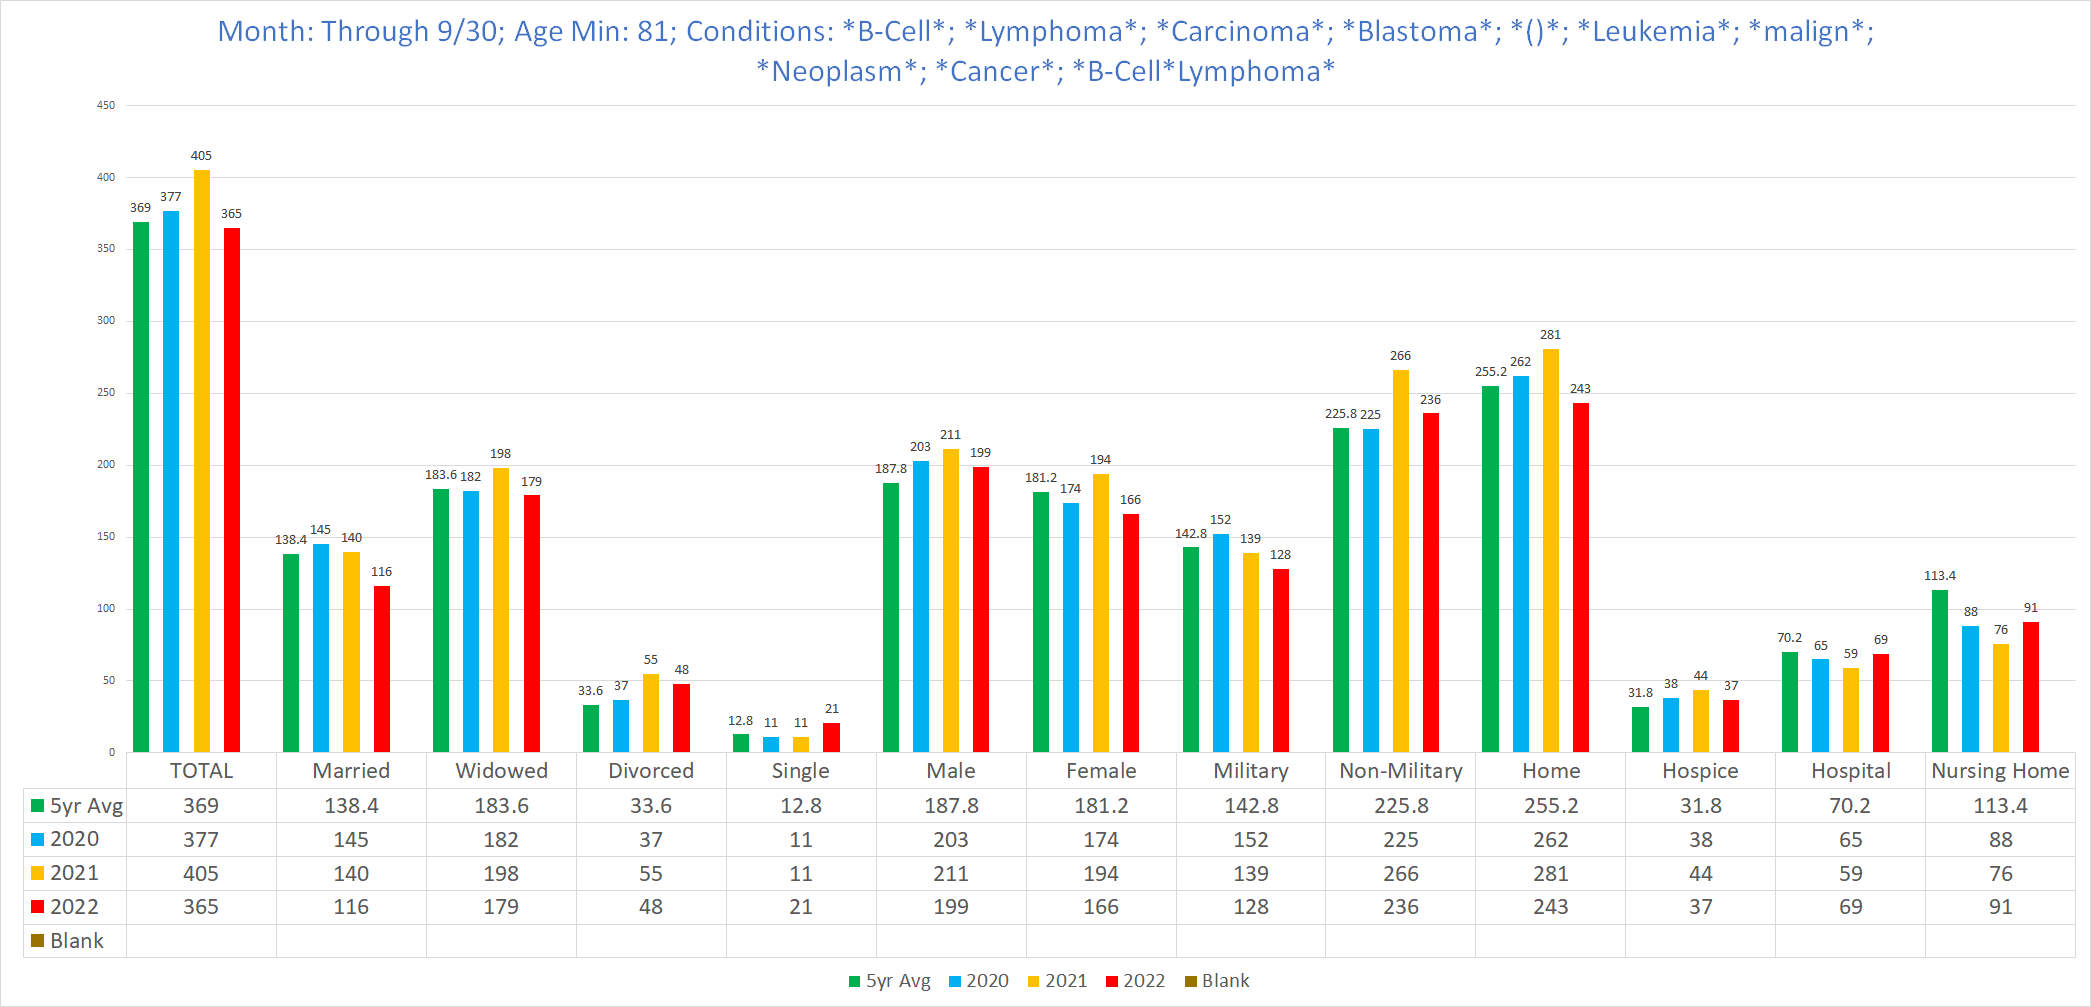
Age 81+:
Observations
While there are numerous observations one can make upon this data, I wish to highlight a select few.
Reliability of the death certificate data
One of the first objections skeptical pro-vaxxers / pro-establishment people tend to raise is that “death certificates are riddled with errors and completely unreliable” (like VAERS).
It is a well-established fact that death certificates are notoriously inaccurate and error prone.1
However, not all information contained in death certificates is equally unreliable or susceptible to errors.
The errors in death certificates are typically one of 2 types:
Lack of clarity:
Where there is a lack of obvious direct cause of death, especially if there is no autopsy, this often leads to ME’s “guessing”.
Discerning between different types of related conditions - for instance, there are numerous different specific cardiac conditions, and while it can be obvious that the direct cause of death was cardiac failure, the precise cardiac condition that ended in the heart failure is often far less apparent, again leading to guesswork (or over-generalizing).
In decadents where there is no obvious CoD altogether, or there is no obvious chain of pathologies to explain the direct CoD, ME’s are left to try and figure it out without the benefit of all the necessary information to arrive at a firm conclusion.
Personal/Subjective failure to deploy the full degree of expertise when assessing CoD’s
Most doctors are not properly trained in determining - and naming - CoD’s (this is a much larger problem than one might think).
ME’s are typically burdened with a workload that exceeds the capacity of their staff to properly assess, which leads to shoddy work. Also, every profession has some percentage of lazy or dishonest folks who don’t take their work seriously enough to bother doing correctly.
Is cancer death certificate data reliable?
More specifically, what we want to know is “are cancer conditions listed on death certificates an accurate representation of cancer conditions causing the death (at least in part)?”
I believe the answer to this question is a confident “Yes”.
There are two pieces of information we need to conclude that the presence of a cancer condition on a death certificate means that the cancer contributed to killing the decadent:
The cancer condition did indeed exist as claimed
The cancer condition contributed to causing the death
Both of these are safe assumptions when it comes to cancer. Cancer conditions are the type of condition that has a confirmed diagnosis on the record, and cancer is certainly not the sort of thing that a ME will pluck from his hat - they would only document a cancer condition on a death certificate if there had been a cancer diagnosis beforehand.
Regarding the second factor, unlike covid, people who die of ‘natural causes’ with cancer are inevitably dying at least in part because of the cancer. There’s no such thing as ‘asymptomatic cancer’ that’s pathologically benign.
(One-in-a-million exceptions do not undermine this as a general rule. For example, there is one homicide in the Vermont DC’s that also listed cancer as a contributing CoD.)
The upshot is that cancer conditions mentioned on death certificates should be a reliable indication that the decadent had cancer and died at least in part because of the cancer.
Reliability of other characteristics, such as demographics
Objective non-medical information such as gender, age and the like are similarly presumptively reliable for the most part.
However, I am not entirely sure about military status, because of the wild disparities whereby military veterans - a group that typically underperforms in clinical outcomes in the US - was almost entirely saved from any and all of the various pandemic-related excess mortalities; plus military status is information that may not always readily available to the ME when filling out a death certificate.
To put this in perspective, if this data is accurate, than Vermont’s VA is quite literally the best healthcare system in the world hands down.
To state such a proposition bluntly calls into question one’s capacity for rational thinking.
Overall, 2021 is worse than 2020/pre-pandemic, and 2022 is worse than 2021
Despite the chaotic nature of the trends within specific individual types of cancer conditions or terminologies used, the overall trend of pre-pandemic/2020 < 2021 < 2022 is very stable. This is probably the most definitive and reliable relevant observation that can be drawn from here.
0-50 age cohort
This cohort saw a rise in cancers during 2020. This is not a cohort that should be prone to cancers in the first place, and neither were they at any real risk of covid (which barely registered in Vermont throughout 2020, and even the little covid excess mortality such as there was was relegated to old men).
However, it seems odd to say the least that lockdown policies should result in an immediate spike in cancer mortality for an age cohort facing little mortality risks altogether that would manifest as cancers, although perhaps I am missing something important here.
80+ age cohort
I suspect that the relative decrease in 2022 for the 80+ cohort compared to other age groups might just be because the excess deaths of 2020 and 2021 - both cancer and non-cancer - depleted the reservoir of susceptible 80+ year old’s so there just weren’t enough of them available for cancer deaths in 2022 to juice the numbers to the same relative extent as other age cohorts.
2022 - shift to cancer deaths in hospitals
I don’t know if this reflects something significant, but there was definitely a noticeable shift in the overall distribution of cancer deaths from homes & hospices to hospitals and to a lesser degree nursing homes.
*********
Ultimately, this much we can say definitively: there is an anomalous excess of cancer-related deaths in Vermont that is becoming progressively worse at least as things stand now.
How much of this is because of pandemic policies, covid, and the vaccines does not seem clear from the data presented above. On the flip side, there is nothing in this data that suggests the vaccines are not a primary culprit behind the soaring cancer excess deaths.
If only we had access to a much bigger database, then much if not all of the ambiguity in this truncated dataset might be resolved. . . . . . .


For instance, see:
Discrepancies between clinical and autopsy diagnosis and the value of post mortem histology; a meta-analysis and review
Survey of New York City resident physicians on cause-of-death reporting, 2010
Does quality control of death certificates in hospitals have an impact on cause of death statistics?
Accuracy of death certificates in COPD: analysis from the TORCH trial
Using National Inpatient Death Rates as a Benchmark to Identify Hospitals with Inaccurate Cause of Death Reporting - Missouri, 2009-2012
Death certification errors at an academic institution
Inaccuracy of death certificate diagnosis of tuberculosis and potential underdiagnosis of TB in a region of high HIV prevalence
Quality of cause-of-death statements and its impact on infant mortality statistics in Hermosillo, Mexico
Infant Mortality, Cause of Death, and Vital Records Reporting in Ohio, United States








It's all part of big pharma's plan to create thousands of new cancer patients using extremely expensive and mostly useless cancer drugs.
Thank you . I believe it's the same in CT!!