Pandemic of Deadly Accidents, Part 1: What is behind the rise in fatal falls in Minnesota for all ages during the pandemic years?
Humpty Dumpty listened to Fauci, Humpty Dumpty fell & got a big Ouchie (Alt: Humpty Dumpty got injected, Humpty Dumpty's skull became segmented?)
Some of the notable types of side effects documented for the covid vaccines include strokes, syncopes (fainting / loss of consciousness), and a bevy of neurological deficits that can cause sudden weakness -- all of which can lead to a an accidental physical trauma, such as falling and banging your head on the floor or a car crash. These can also lead to accidental injuries from exposure to something dangerous as a result of becoming incapacitated, for instance if you’re swimming and stroke out, there’s a good chance of drowning.
I figured it would therefore be worthwhile to see what the trends in mortality caused by these sorts of accidents look like.
(*** If you want to skip the intro, click here)
Intro
Point #1
Due to their rarity, deaths from accidents caused by something external to the dead fellow have two distinct advantages when it comes to trendspotting:
Since they are relatively rare - especially the really specific ones such as ‘falls involving a bed’ - even a small increase in absolute numbers will be noticeable (if there are usually 10 wheelchair deaths/year and a year has 16, an increase of 6 is 60% excess).
They are often rare enough to make the threshold for exceeding the year-over-year increase attributable to population growth / aging pretty low.
In 2019, there were 2,263 deaths caused by *any* kind of “fall” in Minnesota from a population of about 5.64 million people - or about 1/2,500. In 2023, Minnesota’s population is estimated (per Google) at 5.714 million, an increase of about 70,000-75,000 over the 2019 population. . . good for a paltry 28-30 additional deaths from “all-cause falling” by 2023 compared to 2019, or an additional 7-8 per year. That’s 28-30 above 2,263 - so if there are 2,294 deaths, that’s already above the projected increase due to population growth.
(This is an oversimplified explanation of accounting for demographic evolution, not intended to be a precise accounting.)
Point #2: Before we get to the meat and potatoes of this article, it is necessary to preface it with one gigantic caveat
The primary objective here is to highlight *anomalous trends that are significant* in the death data for the pandemic years, especially after 2020. An anomalous trend in our case is simply an unexpected increase or decrease in the number of deaths within any given specified parameters, such as a period of time (e.g. a calendar year) or a specific cause of death (e.g. cardiac arrest), that is too large and/or sustained to be presumptively attributed to random chance.
Anomalous trends in themselves do not supply or prove the reason *why* the trend exists. They simply suggest an increased likelihood that the increase or decrease in deaths is not the product of random chance, rather there was a specific factor that caused the trend to occur - in other words, something caused more or less people to die than we would’ve expected based on historical experience and data.
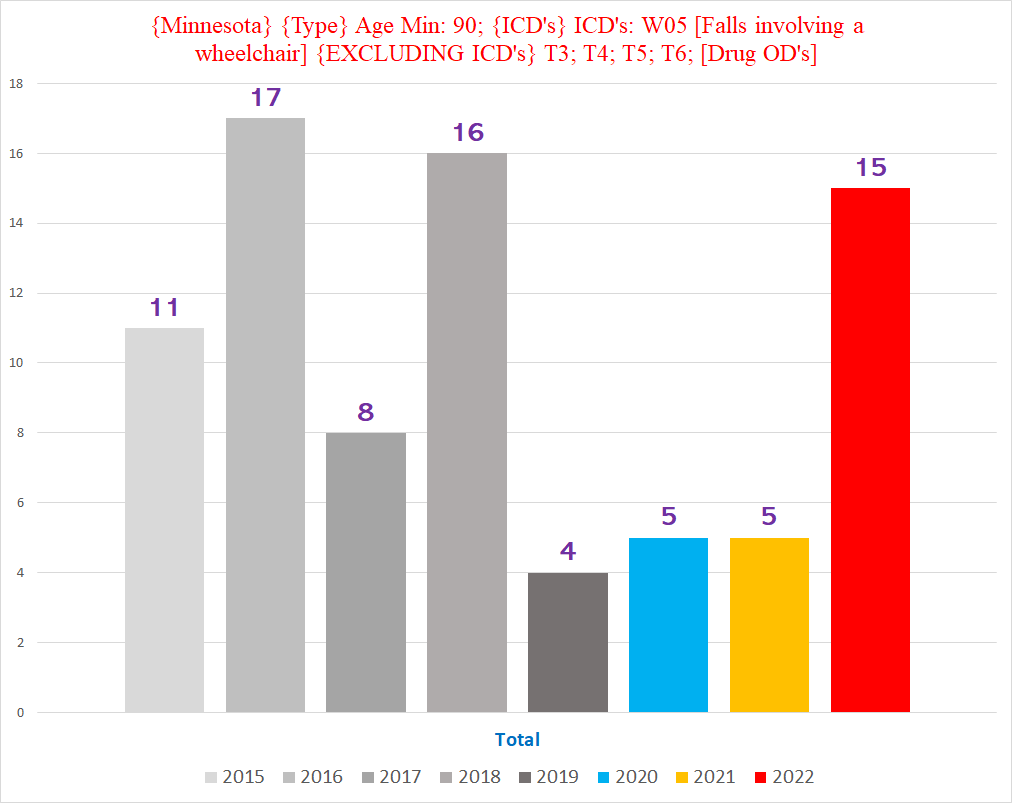
Furthermore, if you dig deep enough, you are bound to find anomalies in any large dataset, so any given anomaly is not even automatically meaningful in the first place. For example, if we look at deaths caused by a ‘fall involving a wheelchair’ in those aged 90+, we can see the following alarming spikes in 2016, 2018, and 2022:
(explanation of the chart title in footnote1)
Such a ‘trend’ hardly proves the existence of the Wheelchair Wacker serial killer targeting nonagenarian Minnesotans in 2016, 2018 and 2022 (although you never know, maybe he missed 2020 because of the lockdowns. . .)
Finally, depending on the situation, some anomalous trends can be easier and more obvious to interpret than others. I am leaving the interpretation of the trends that we will explore to the reader.
Point #3: One more quick primer on a few of the concepts that are impossible to avoid when discussing trends in death data:
Excess Deaths / Excess Mortality - Excess deaths refers to deaths that are “unexpected” or "that shouldn’t have happened” under ‘normal’ circumstances. For example, the number of deaths per year is relatively stable year over year (with a slight increase (about 1%) because of population growth), so it would be ‘unexpected’ that there would be 5% jump in deaths year over year.
Statistical Significance (or significance for short) - Something that is unlikely to be the result of random chance. In medical science, the threshold for being considered “statistically significant” is if the likelihood of something happening by chance or luck is less than 5%. If you predicted you would roll a “6” on a single die & you then rolled a 6, that is not significant enough to presume it was not just luck, because the odds of rolling a 6 are 1/6 = 16.6%, which is greater than 5%. However, if you predicted you would roll a double six & then did so, that would be statistically significant - meaning unlikely to be the product of random chance - because the odds of rolling double sixes is 1/36 = 2.8%, which is less than 5%. (Yes, the 5% threshold for statistical significance is arbitrary and often does not make much sense depending on the context - consider that rolling double sixes is not exactly such a rare event over the course of a game.)
Cause of Death (CoD for short) - a medical condition or injury that is identified on a death certificate as having contributed to the death of that person. (CoD’s are not necessarily accurately or honestly documented, which can be an issue when trying to analyze them.)
Underlying Cause of Death (UCoD for short) - this refers to the cause of death that is "the disease or injury which initiated the train of events leading directly to death, or the circumstances of the accident or violence which produced the fatal injury"
Multiple Cause of Death (MCoD for short) - this refers to a cause of death that “includes the immediate cause of death and all other intermediate and contributory conditions listed on the death certificate” (basically all the other CoD’s that aren’t the UCoD)
ICD 10 Codes (ICD’s for short) - ICD stands for International Classification of Diseases. It is a system of alphanumeric codes for all the known medical conditions, used for billing for medical procedures/services and for keeping epidemiological data. The CDC assigns ICD codes for every condition/injury documented as a CoD on all death certificates in the US.
Point #4:
All charts and data in this article exclude deaths caused by drug-related causes, to filter out the substantial increase in drug OD’s from confounding trends in deaths from other causes.
*****************************
Vermont
One of the more jarring trends I noticed in Vermont was the more than *doubling* of deaths involving a “Blunt Force Trauma” (BFT) in 2022 compared to before the pandemic. Blunt force trauma refers to an injury sustained from a physical blow to the body, such as a 100mph fastball to the head or falling down the stairs.
This is illustrated by the following two charts.
The first chart shows the total number of blunt force trauma deaths by year, excluding deaths involving drugs (where the drugs are often responsible for traumatic accidents):
Note: for all charts, the years follow a color-coded scheme - 2015-2019 are varying shades of grey*, 2020 = light blue, 2021 = yellow, 2022 = bright red, and 2023 (when included) = purple
(*one chart has 2015-2019 in blues and greens, and the Vermont chart below has them all in dark blue)
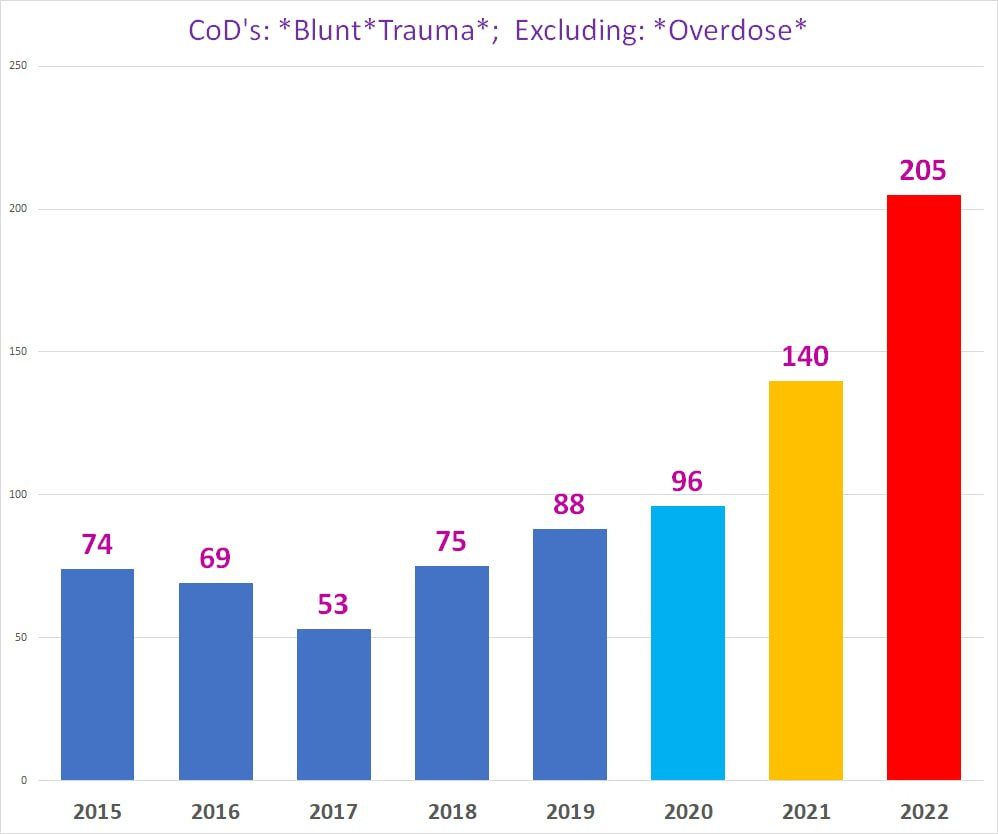
For those who don’t find charts user-friendly (this can’t be repeated without doubling the length of the article though):
2015: 74 deaths
2016: 69 deaths
2017: 53 deaths
2018: 75 deaths
2019: 88 deaths
2020: 96 deaths
2021: 140 deaths
2022: 205 deaths (!!)
The second chart shows the number of blunt force trauma deaths by age group:
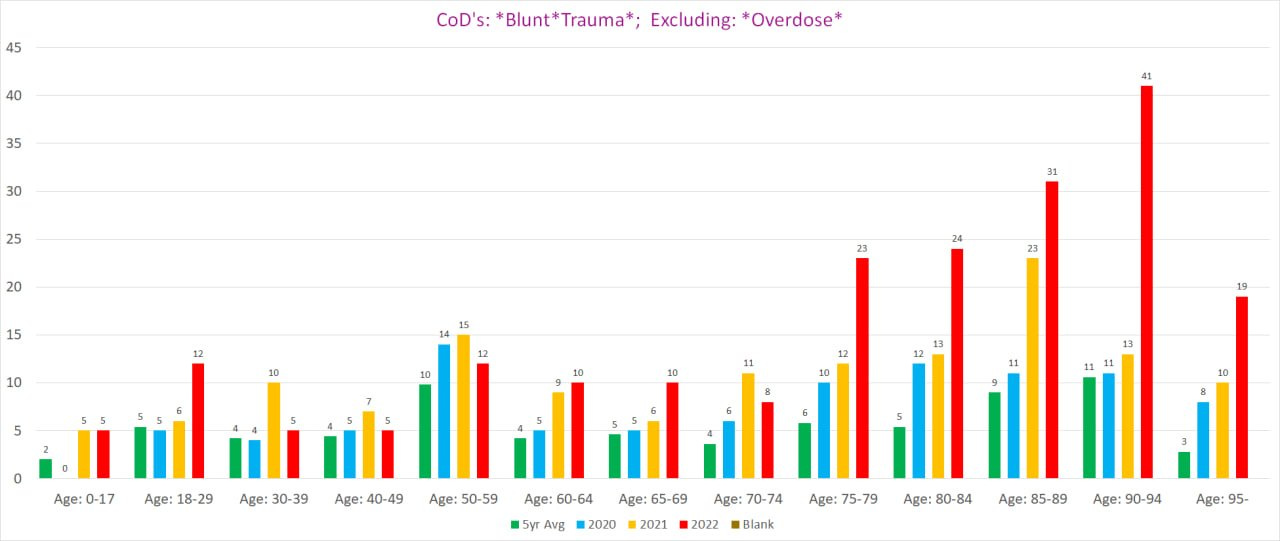
Setting aside the obvious explosion in BFT deaths in 2022, it is worthwhile to point out that 2021 is itself ‘unexpected’. The 140 BFT deaths in 2021 easily eclipses the upward trend from 2016-2020 - 2021 should have had no more than 105-110 such deaths at most if it followed the trend from the previous 4 years.
The jump of 30-40 additional “excess” deaths in 2021 is itself a statistically significant increase year over year in BFT deaths, because random chance is highly unlikely to result in 30-40 additional deaths where such deaths are pretty rare in the first place - before 2021, no year had ever crossed 100 such deaths before. That’s an awful lot of extra rare deaths to account for by random (un)luck.
That being said, 2022 completely dwarfs 2021, shooting up an *additional* 65 deaths above 2021, more than *double* even 2020’s 96 deaths. This is at least 80-85 deaths more than the upper boundary of the above-mentioned trend from 2017-2020 would predict 2022 to land - 120-125 deaths.
Clearly, *something* caused a massive spike in BFT deaths in 2021 and 2022, not just bad luck.
Since we have the death certificates for Minnesota, we can see if there is a similar trend there as well. If there is a similar trend, it would imply the existence of a common phenomenon responsible for both, because it is unlikely for the same unusual phenomenon to occur separately in two different states for completely different reasons.
(****If you want to skip to the long version, click here)
Minnesota’s death data - Short Version
This is a short version or basic summary of the anomalous trends found in *male* Minnesota deaths involving falls that are fleshed out in far more detail below. (This article deals mostly with the male deaths, leaving the female deaths for a Part 2.)
Part 1: Falls involving steps and stairs
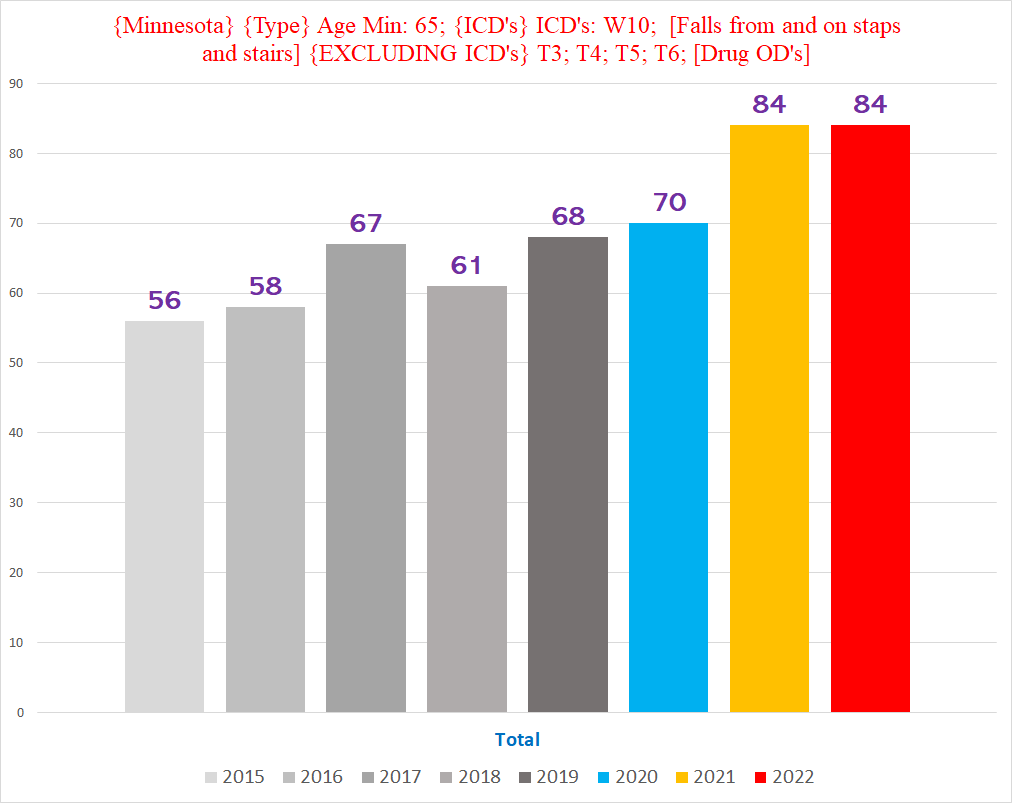
Chart #1 - Deaths involving a fall on stairs, ages 65+ (the seniors)
You can see a clear bump in 2021 & 2022 in deaths that have a staircase fall as a CoD: (*this chart is men AND women combined)
Chart #2 - Deaths involving a fall on stairs, men, ages 30-64 (left) & ages 65+ (right)
There is an obvious, dramatic increase for 2022 in the younger cohort; while there is a clear increase in 2021 & 2022 for the seniors that is less dramatic:
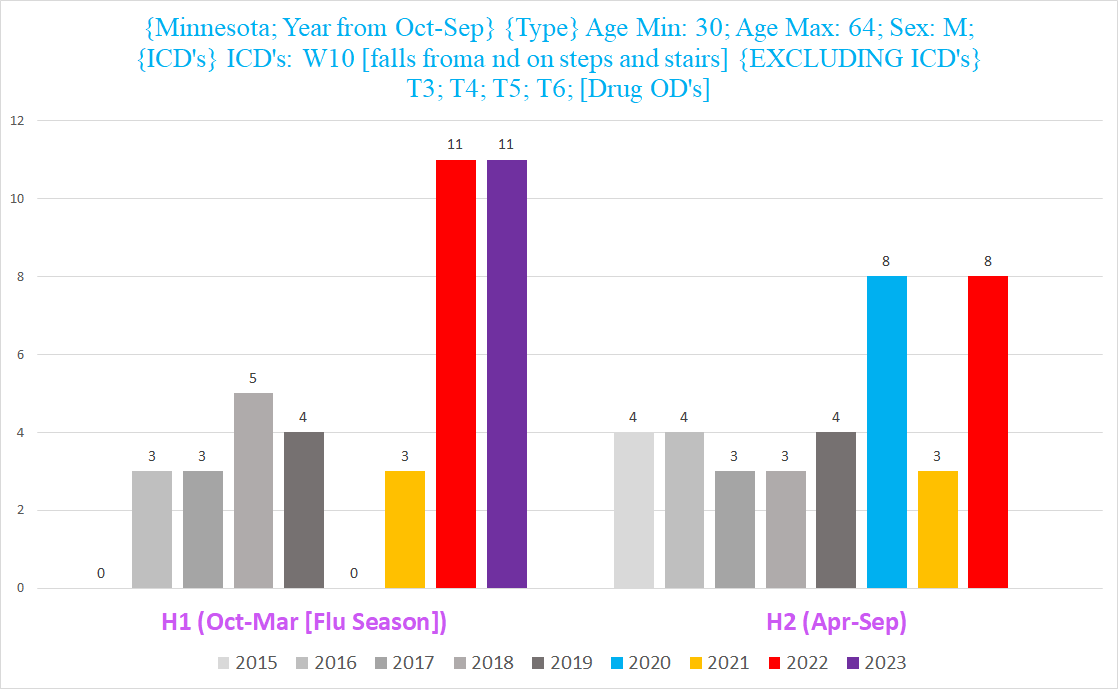
Chart #3 - Deaths involving a fall on stairs, men, ages 30-64, by half years - October 1 -- March 31 (left) & April 1 -- September 30 (right)
NOTE: Here each year starts from the October of the previous year; i.e., 2023 H1 = October 2022 - March 2023, 2022 H1 = October 2021 - March 2022.
There is a dramatic increase in the winters of 2021-22 & 2022-23:
Chart #4 - Deaths involving a fall on stairs, men, where the fall is the Underlying CoD (UCoD)
Remember, UCoD means that it is the injury or condition that directly led to the death.
Again we see 2022 stands out like a Pinocchio:
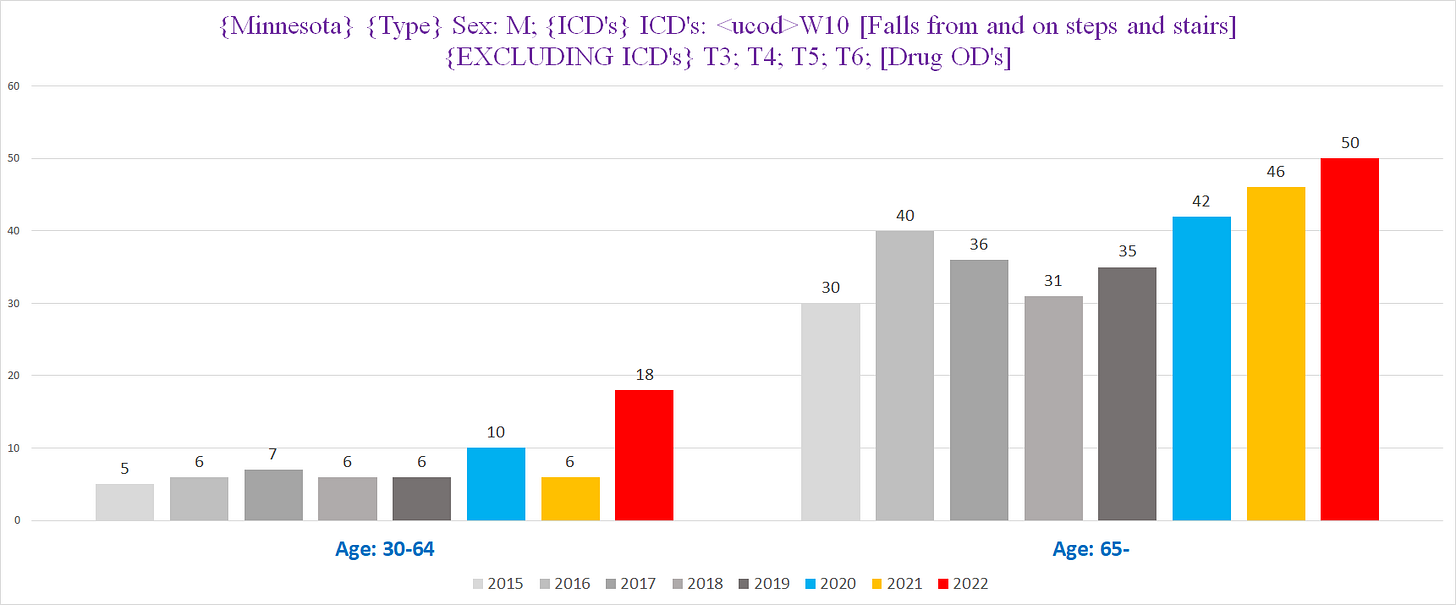
Chart #5 - Deaths involving a fall on stairs, men, where the fall is the Underlying CoD (UCoD), ages 30-64 (left) & ages 65+ (right)
When we look at only the staircase deaths where the staircase fall was the UCoD, we see the same trend as we did above for all staircase deaths (whether UCoD or MCoD). The increase is a bit more pronounced in the younger cohort though - there are *TRIPLE* the normal amount of such deaths for a year in 2022:
Part 2: Other & Unspecified Falls (i.e., falls where there aren’t further details or external causes for the fall)
We’ll call these “Plain Falls”
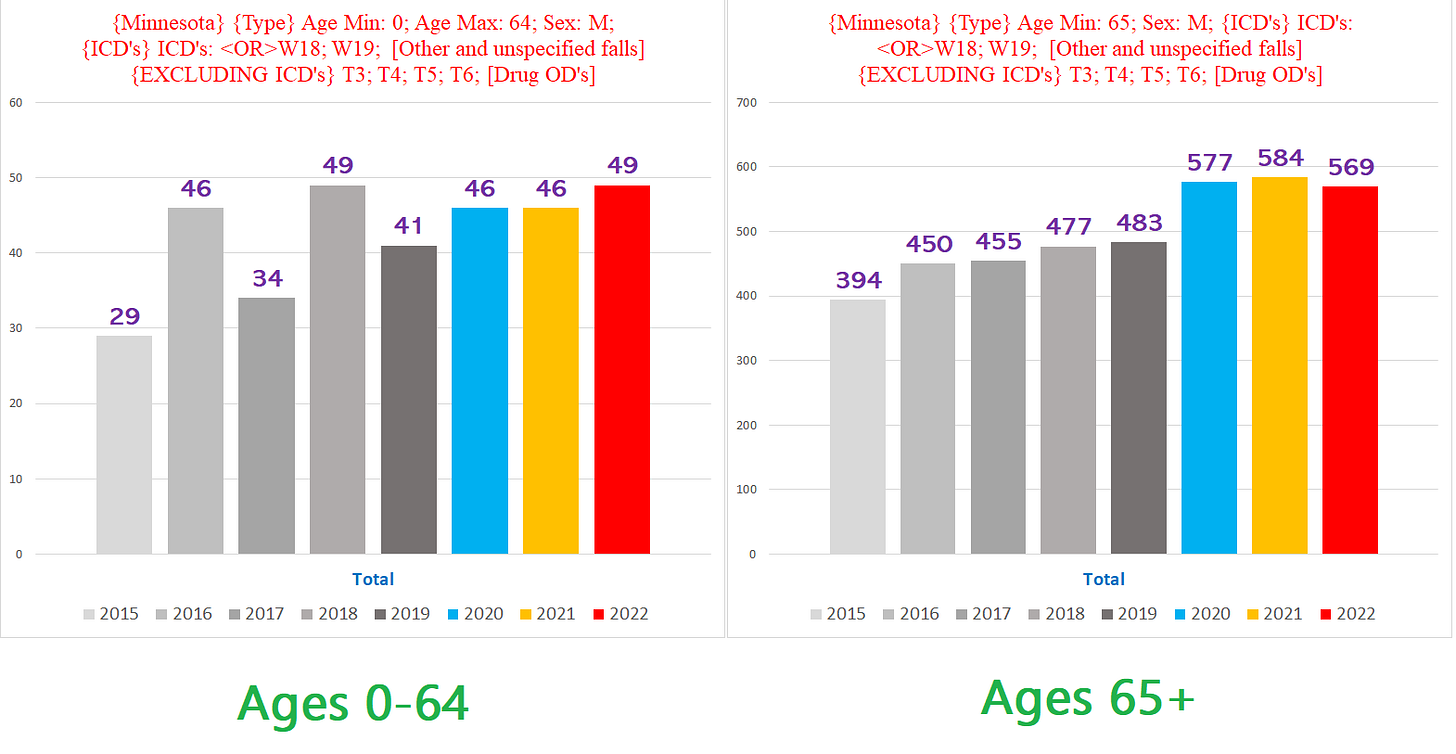
Chart #1 - Deaths involving a plain fall, men, ages 65+
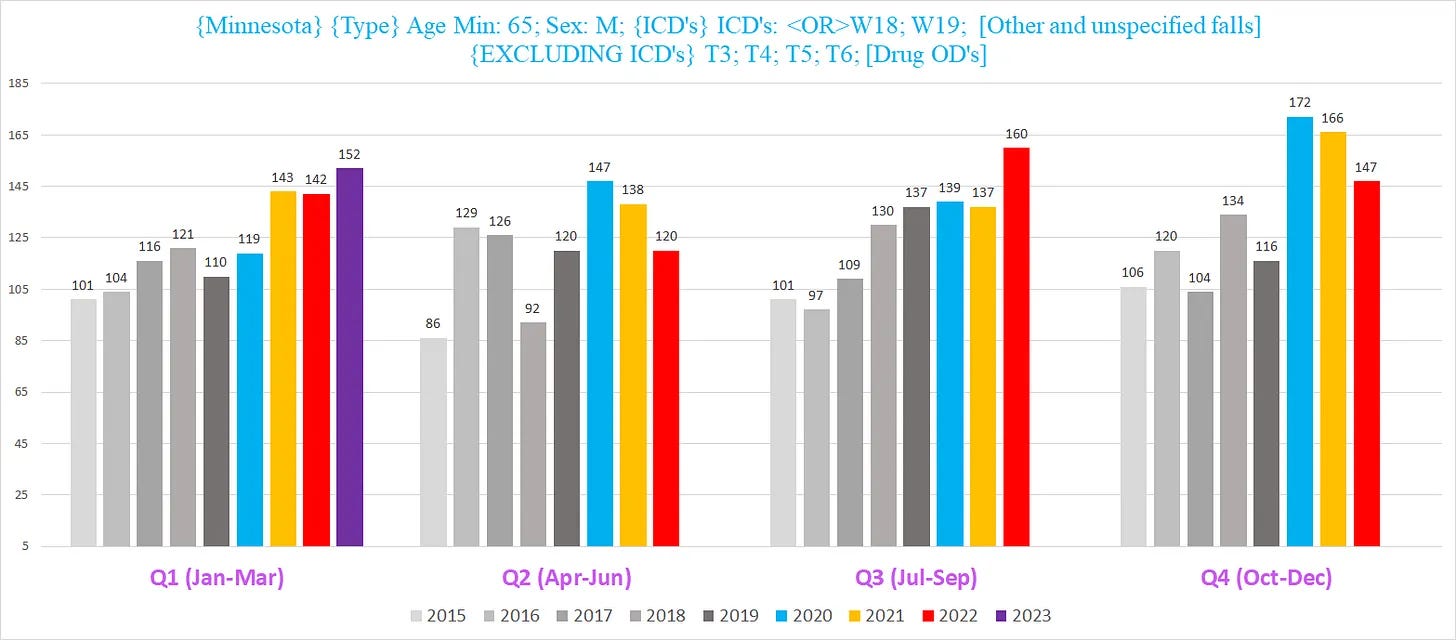
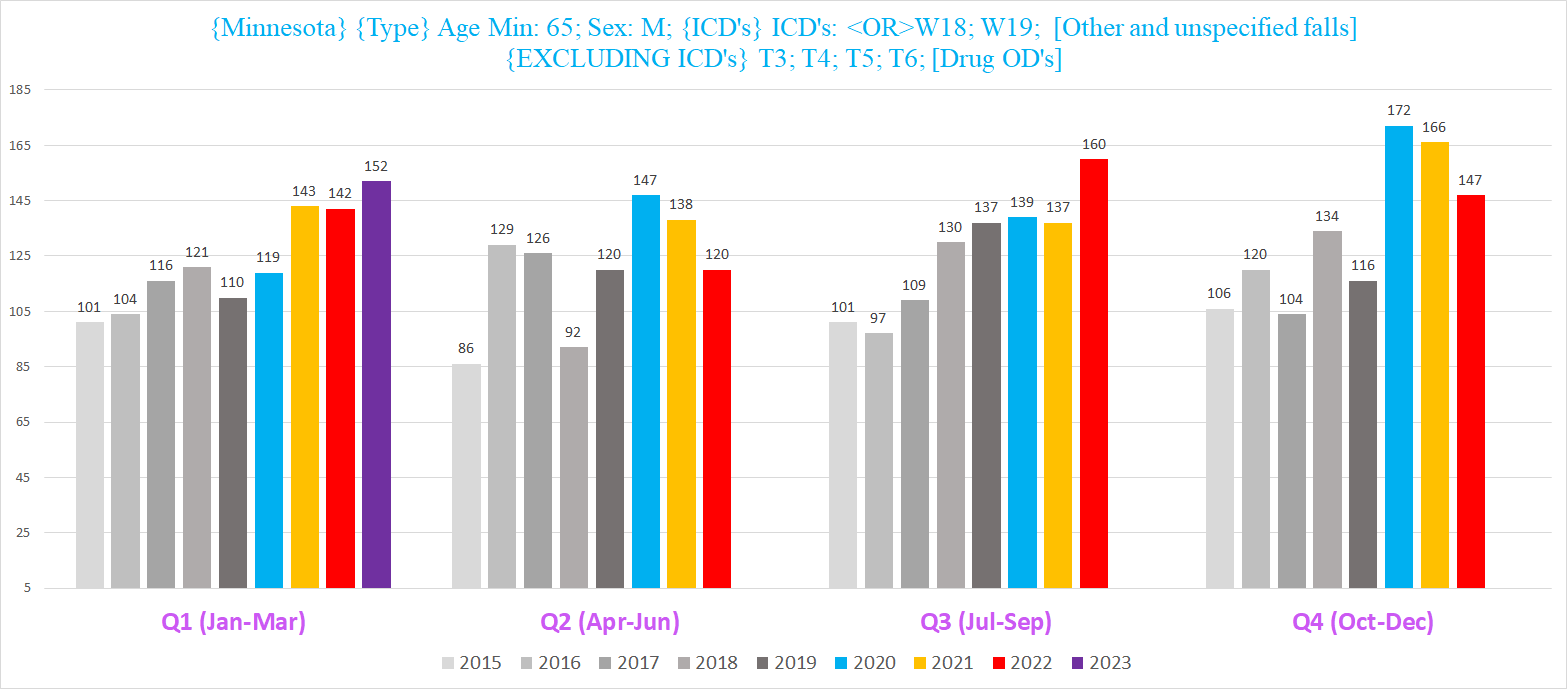
Chart #2 - Deaths involving a plain fall, men, ages 65, broken down by quarter year
The purple bar in the left-most group - Q1 of each year - is for 2023 Q1 (we only have complete 2023 data for the first three months so far).
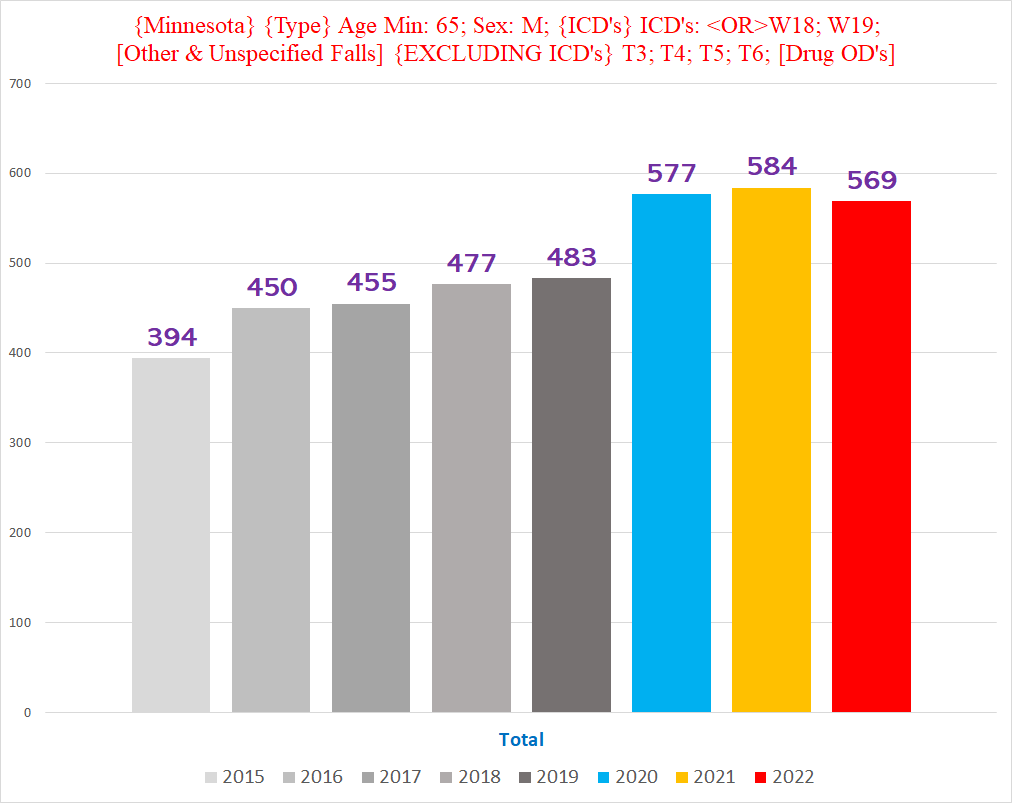
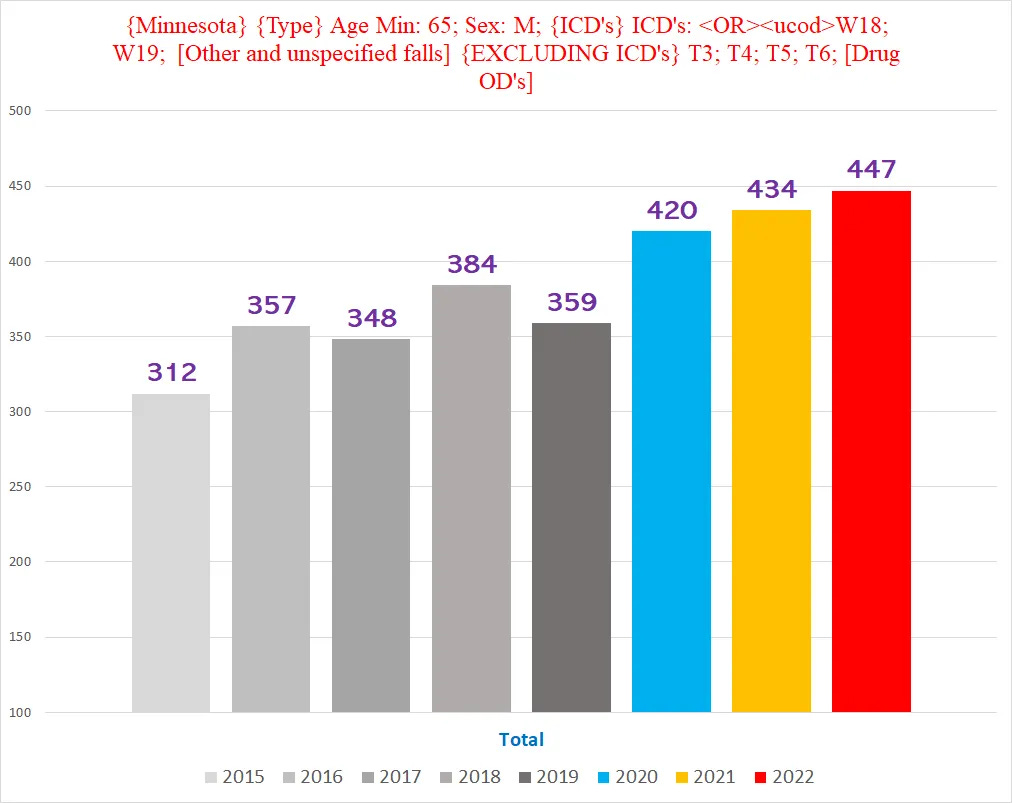
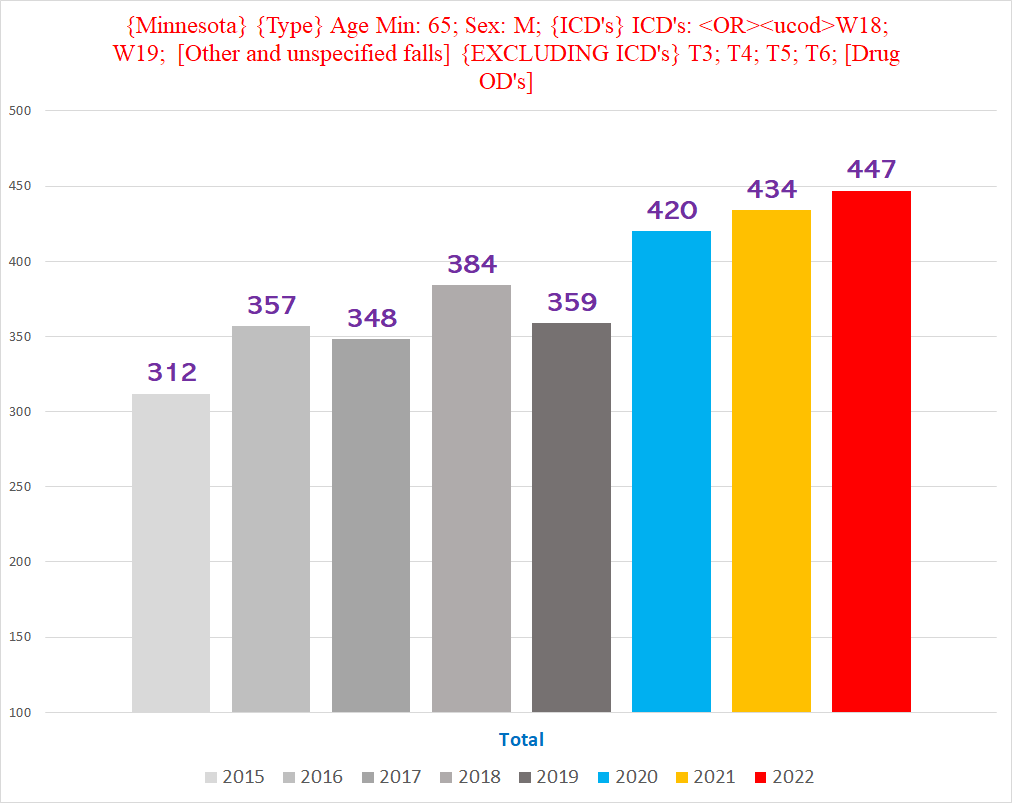
Chart #3 - Deaths involving a plain fall, men, ages 65+, where the fall is the UCoD
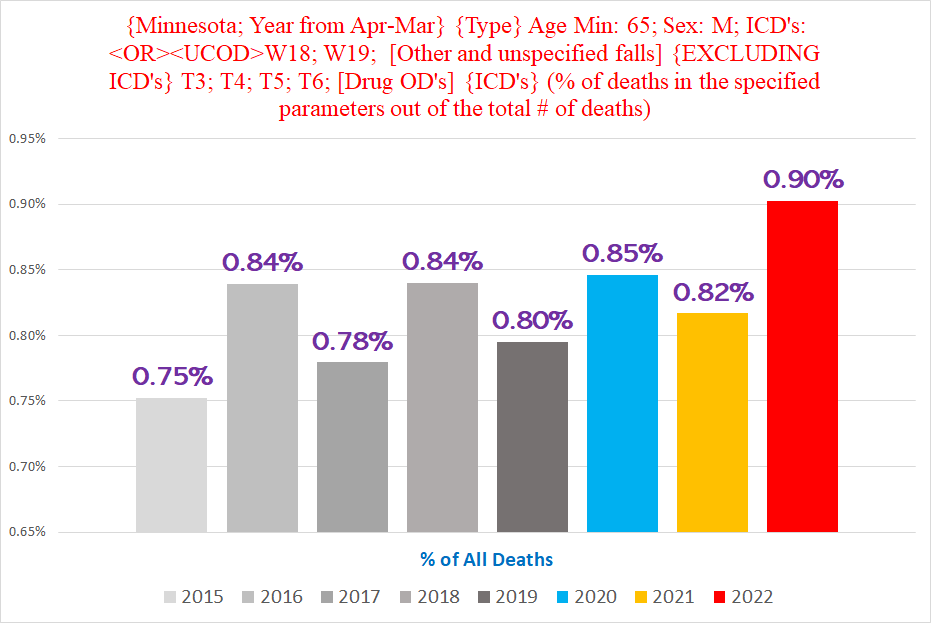
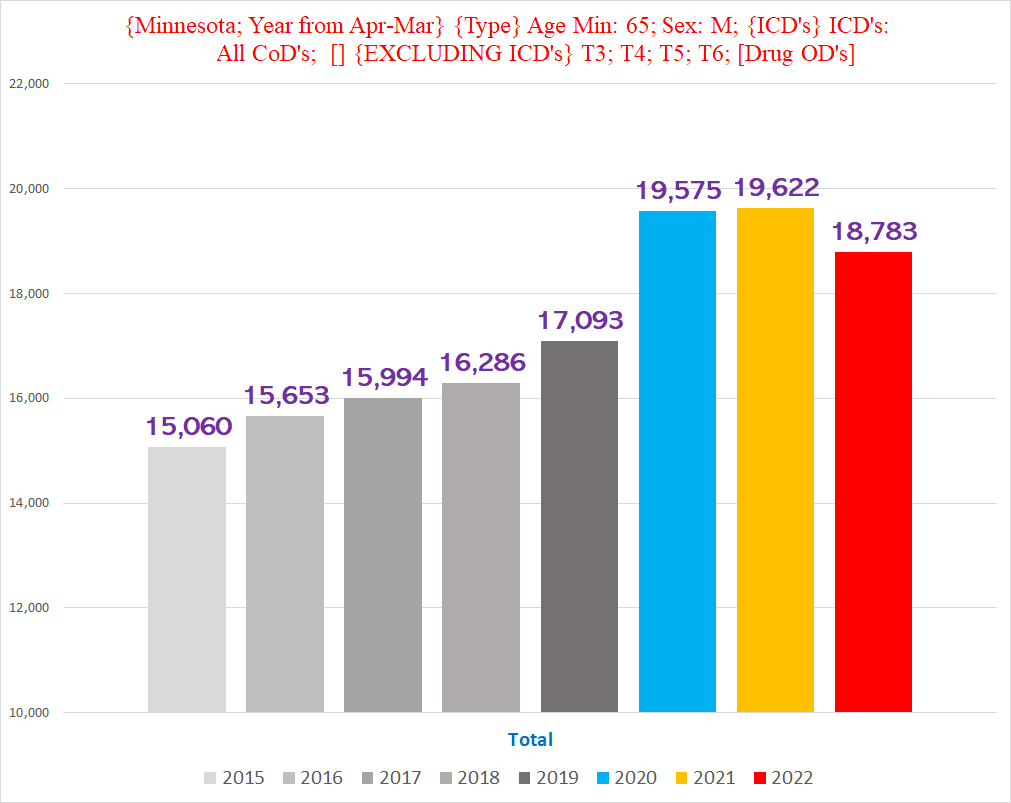
Chart #4 - Deaths involving a plain fall, men, ages 65+, where the fall is the UCoD, and each year begins April 1 and ends March 31 of the following year
If we shift each year three months forward to start April 1 instead of January 1, the excess ‘plain falls’ UCoD deaths is more distinct and significant:
Basically, there seems to be a clear increase in deaths caused by falls involving a staircase and ‘plain falls’.
Minnesota’s Death Data - Long Version
For reference, here is the tally of all deaths in Minnesota by year, excluding drug-related deaths:
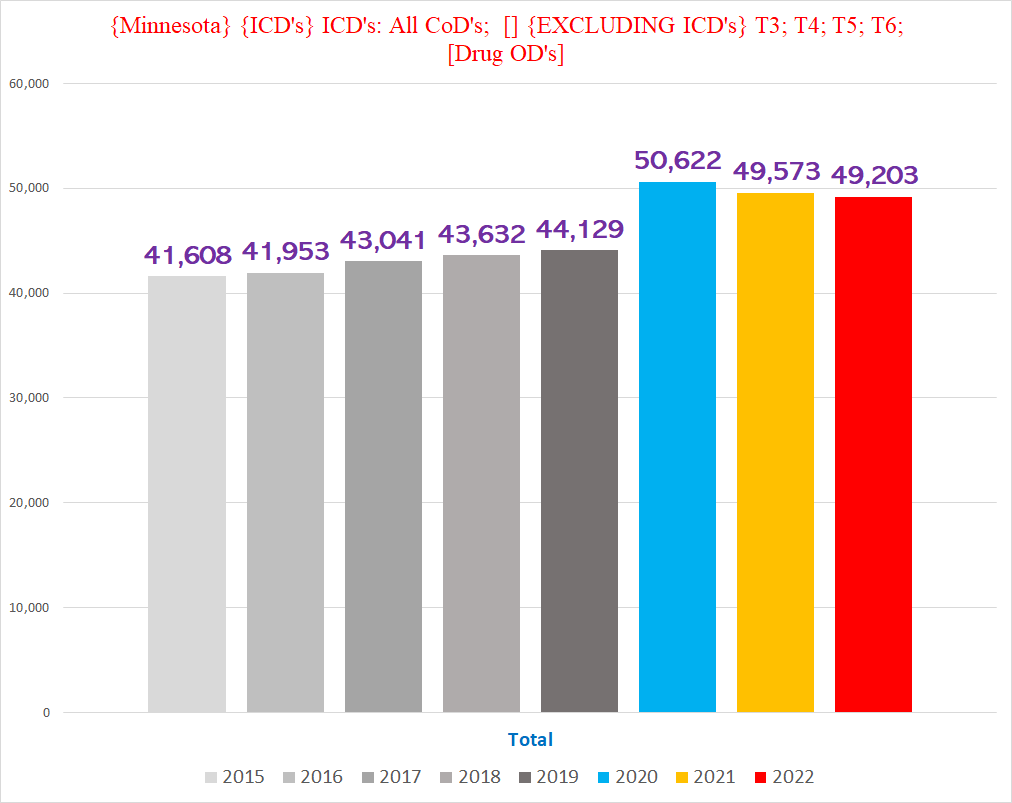
Unlike Vermont, Minnesota provided the ICD 10 codes for the death certificates, which is definitely more user friendly than standardizing the text descriptions (and spelling) of hundreds of different doctors/coroners/ME’s. Minnesota also has about 8x the population and deaths of Vermont.
The ICD codes that are the most germane for us are V01-X59, “Accidents”.
There are two subgroups of this “Accident” category - Transport Accidents (ICD codes V00-V00) and “Other external causes of accidental injury” (i.e. everything else) (ICD codes W00-X59):
There’s a lot to unpack here, but we’re going to stick to ‘falls’ for this article (and won’t even finish that).
The ICD codes W0-W19 are for “Falls”. Literally, a veritable Humpty-Dumpty paradise:
Minnesota Data
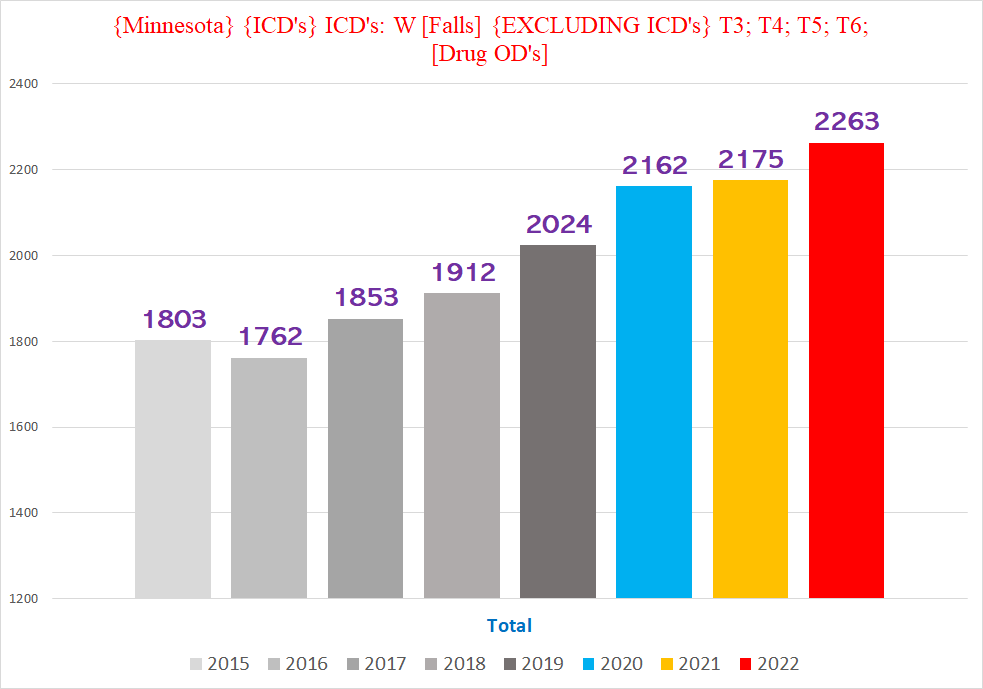
The chart below shows all deaths with a W ICD code (W00-W99):
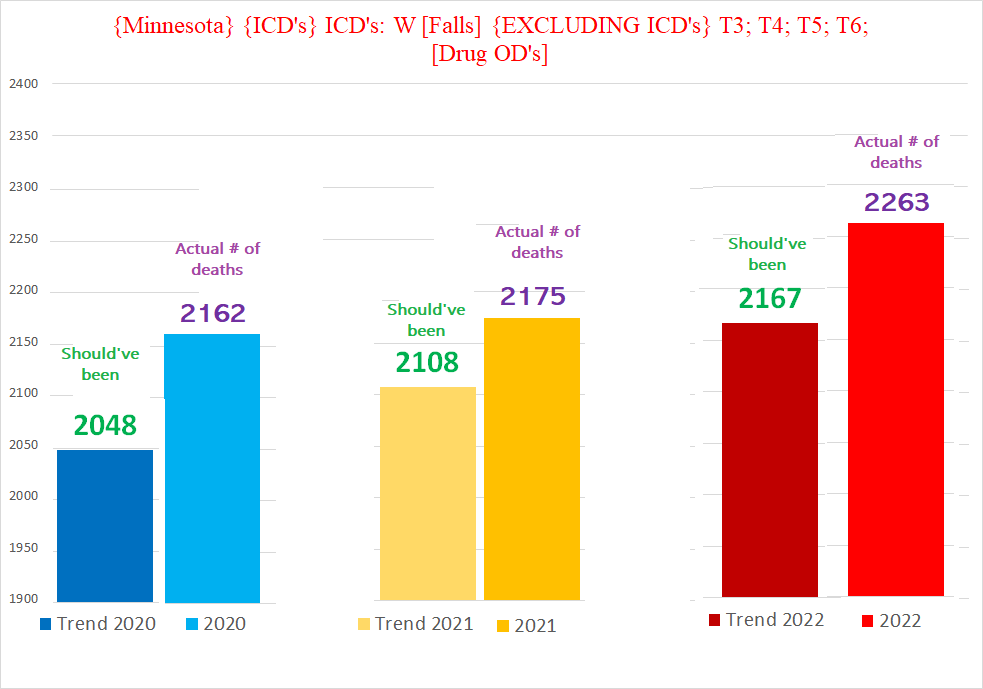
There is definitely an increase, although not quite as pronounced as the signal of BFT deaths in Vermont. This is true even accounting for the upward trend going into the pandemic years - if the trend held for the pandemic years, then the number of deaths should’ve been the numbers shown in the lefthand columns below - yet in all three years, the actual number of W deaths exceeded the ‘expected’ number:
(My paint skills are clearly wanting. . .)
This is potentially a signal of excess, but isn’t necessarily a wild aberration. But we can drill down to isolate where this excess is coming from:
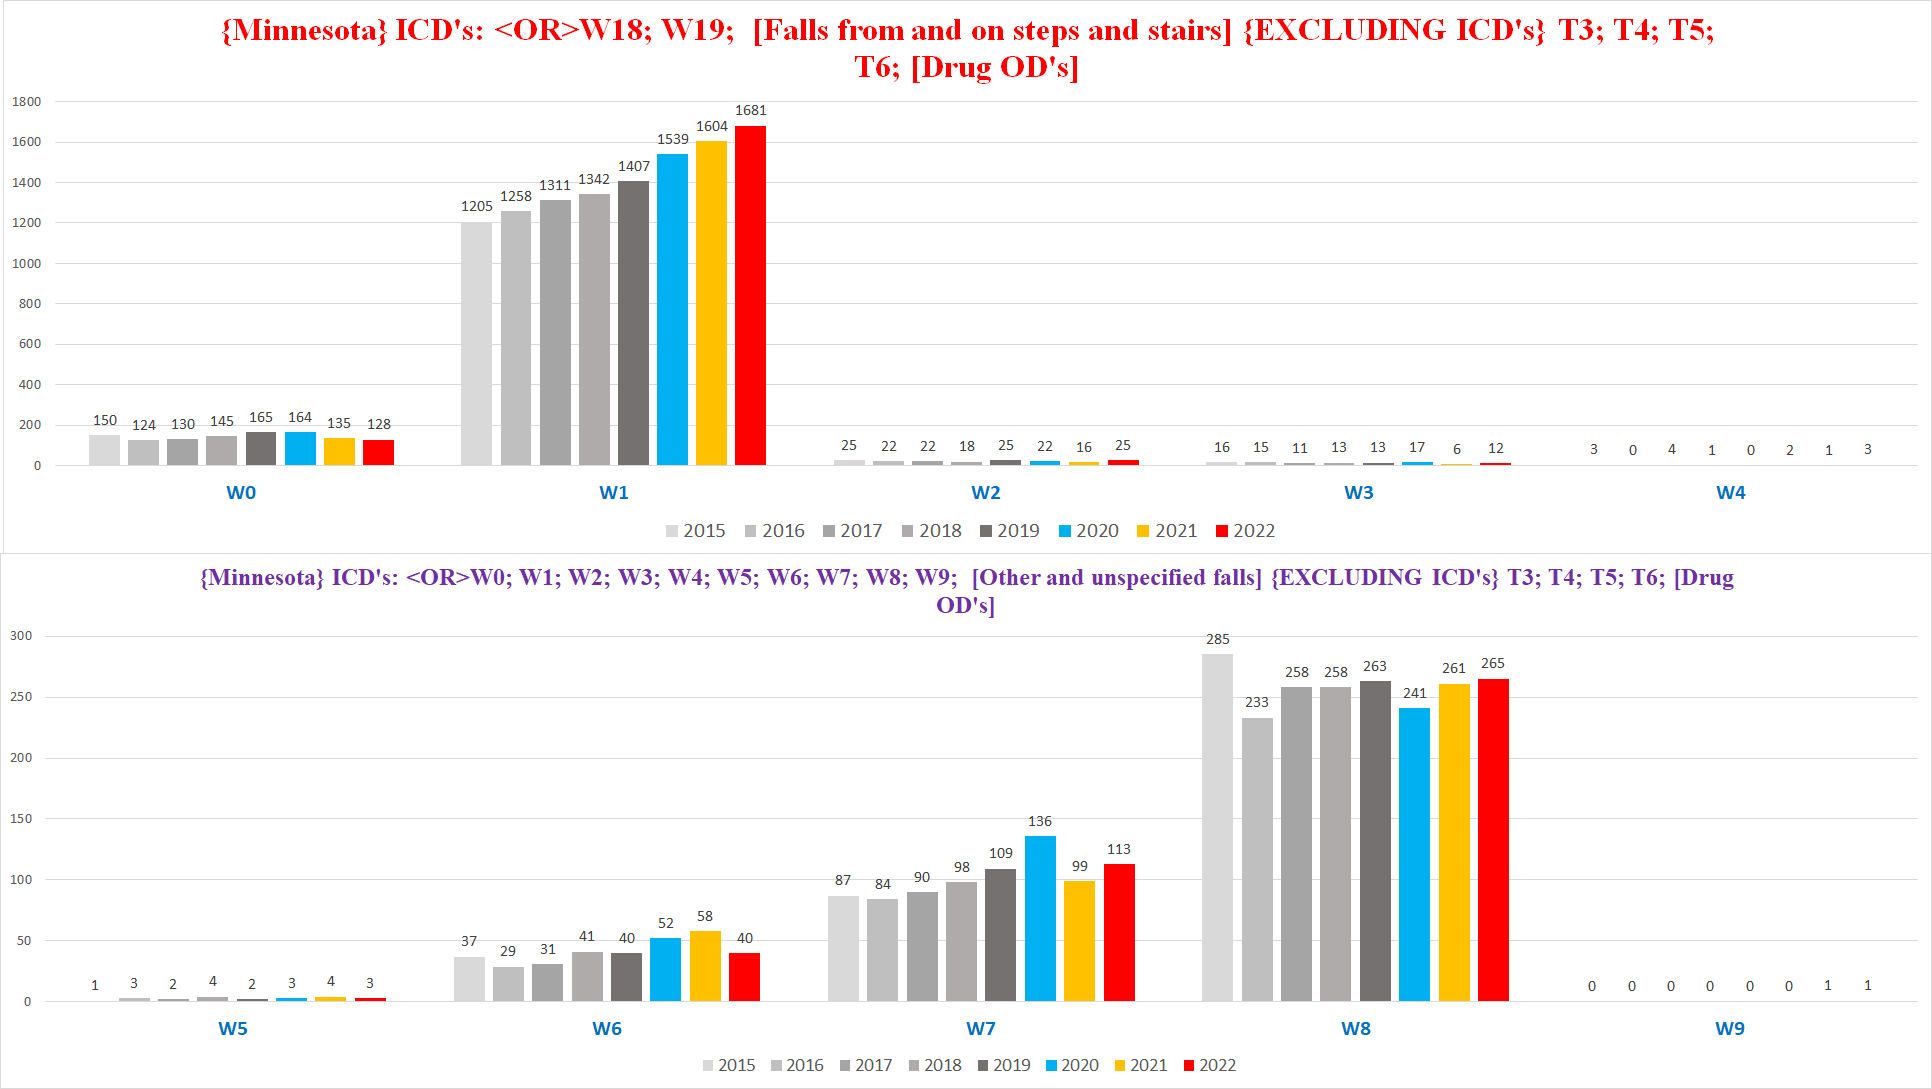
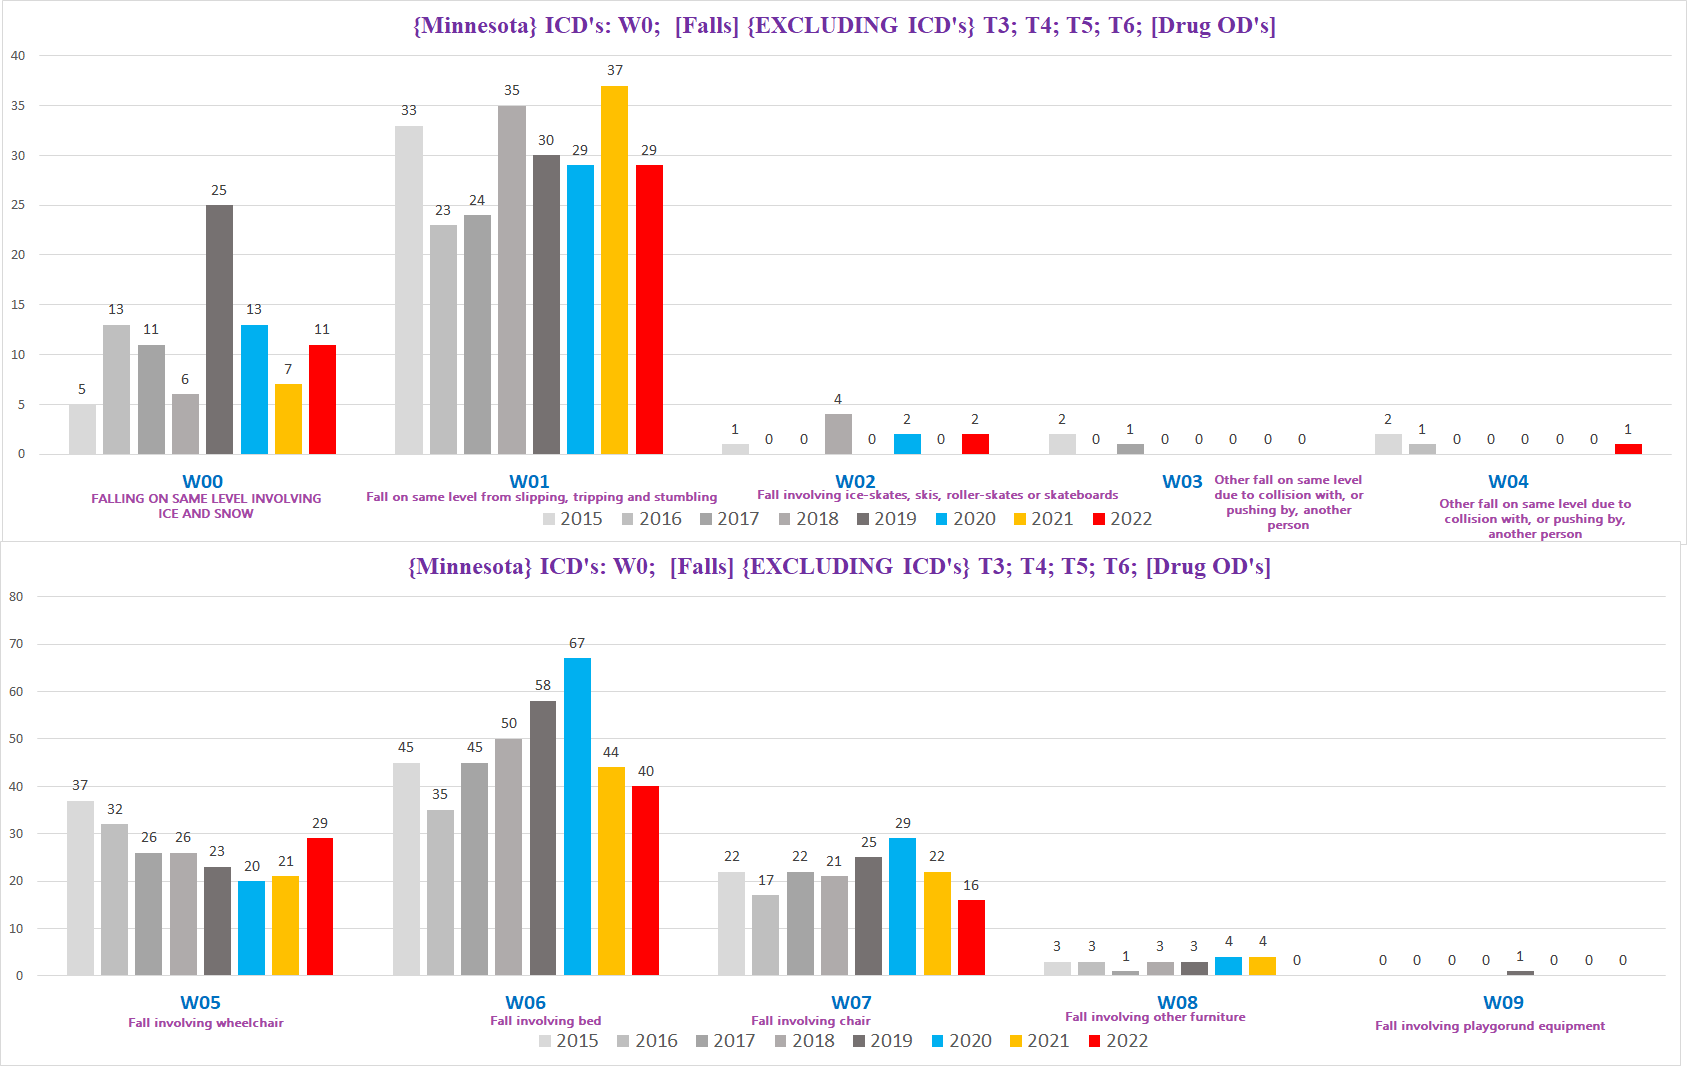
Here is how the W codes break down, W0-W9 (we’re not going to cover all of them in this article):
First up are the W0’s (W0 includes W00-W09; W1 includes W10-W19):
Yup, there’s actually a drop in the number of W0 deaths in 2021 & 2022. (It’s important to point out where the data might not fit a preferred hypothesis.)
Here’s how they break down individually:
When we look at the W0’s individually, it seems to be mostly ‘noise’ - in other words, meaningless trends - the numbers are both low and all over the place:
Half of them (W02, W03,W04, W08 and W09) have too few to be a meaningful trend, but they do contribute
2019 had an epidemic of people fatally slipping on ice and snow (W00), at almost double the normal rate of such deaths
Beds (W06) were becoming increasingly deadly to Minnesotans, topping off at an impressive *67* deaths involving bed mishap (!?!), which broke in 2021.
Chairs claimed a few extra lives in 2020 (perhaps people spending more time in lockdown got bored watching Netflix)
Wheelchairs (W05) were becoming safer, at least until 2022
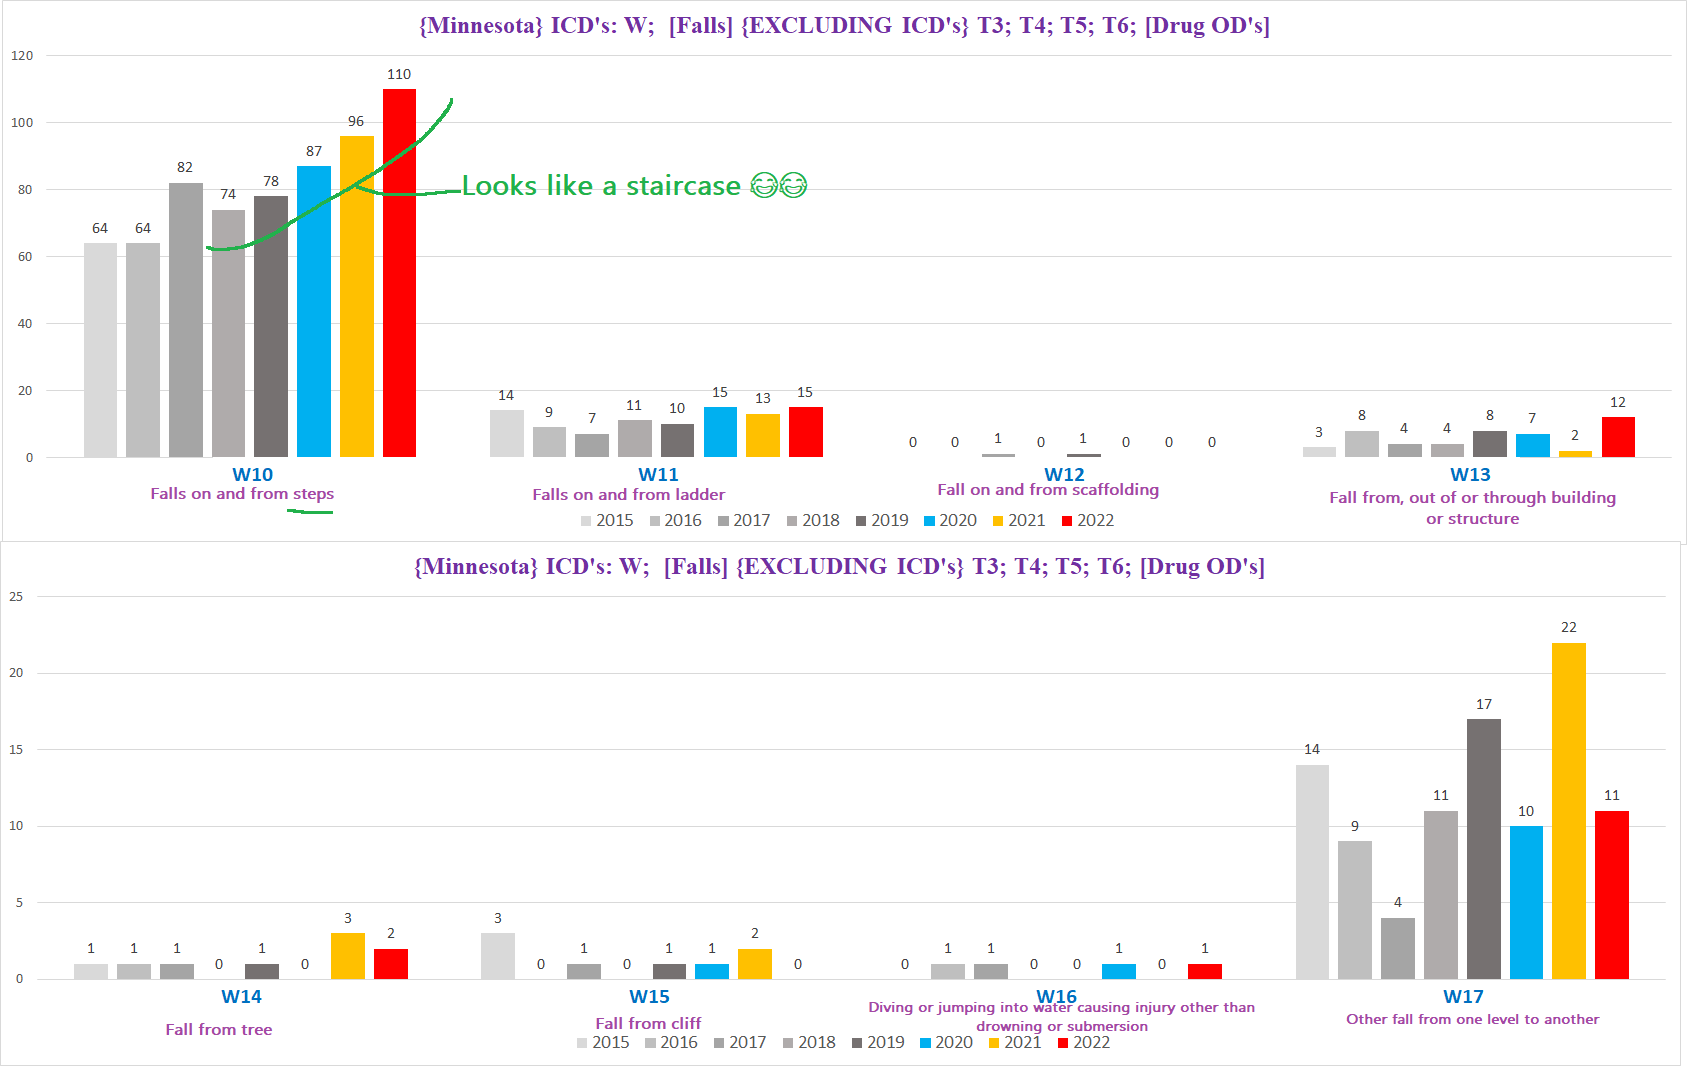
Here are the W1’s excluding W18 & W19 (we’ll get to those in a bit):
Except for W10 - falls on and from steps - the rest are indistinguishable from statistical ‘noise’ - there’s too much variation and too few deaths to derive anything meaningful.
W10 however looks a bit interesting, and is worth looking at a bit more in depth to see if there is a real increase above the expected baseline in fatal encounters with the stairs.
Staircase fatalities are far less likely to significantly fluctuate than most other types of falls, because the degree of exposure people have to stairs is relatively constant - stairs are a fixture in almost all homes and commercial buildings, they tend to ‘work’, and people’s use of stairs in the aggregate is also fairly consistent (most people don’t undergo radical lifestyle changes such as becoming wheelchair bound or a drastic difference in the amount of time spent in a building or location where stairs are a part of access).
The ubiquity of stairs also means that
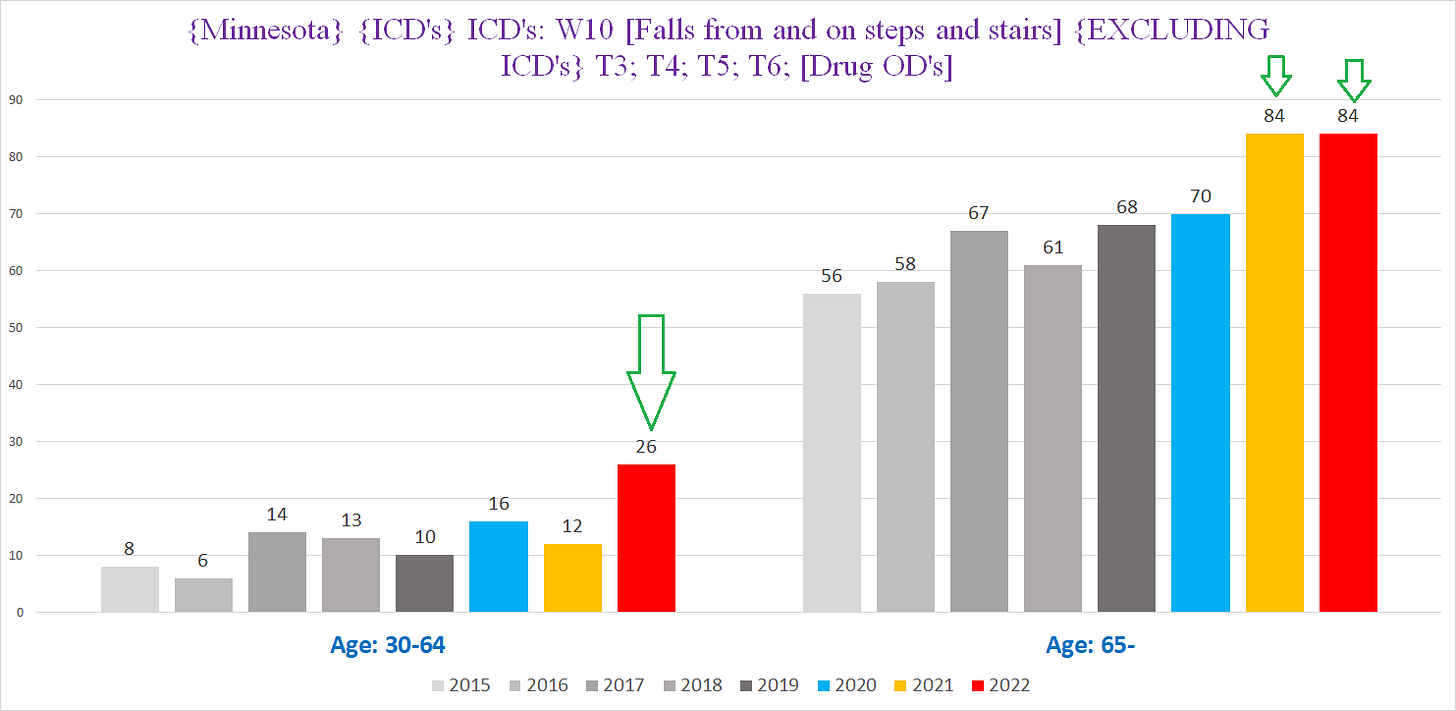
If we break it down by age group, the picture changes dramatically:
The left side shows the number of staircase fatalities for the 30-64 age cohort, the right side shows the seniors (65+; below 30 there are a grand total of 2 from all years combined). Both groups show what look to be real signals indicated by the green arrows.
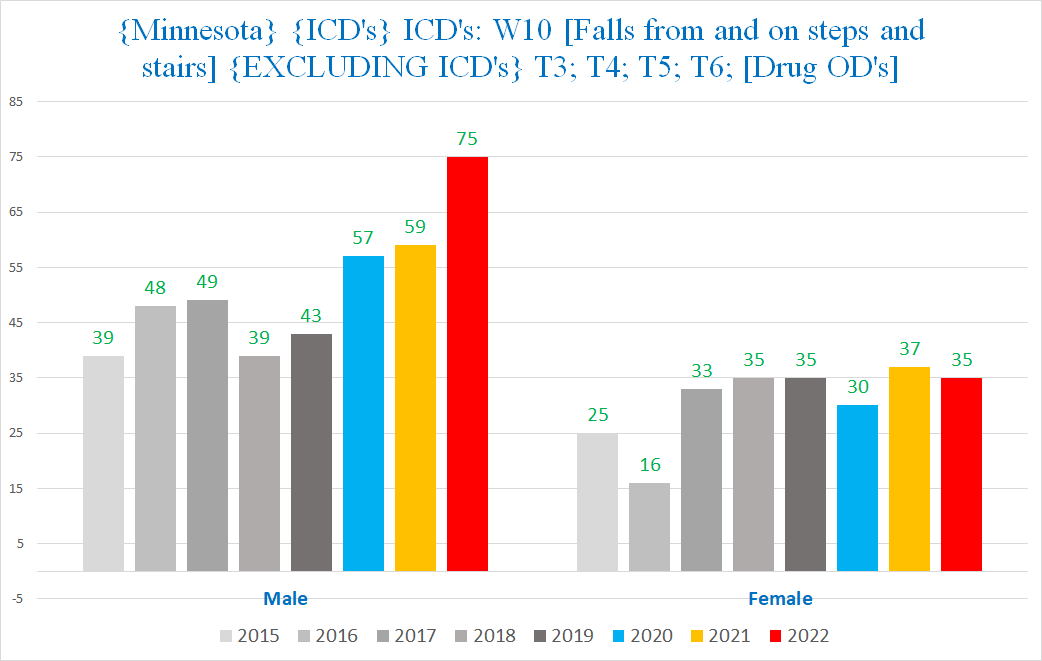
If we break it down by sex, we get the following:
Yup, it’s all on the men’s side - the ladies have nothing doing at all, no suspicious increases, but the men on the other hand, to go from an average of 45 per year or so to 75 per year, that is definitely an anomaly.
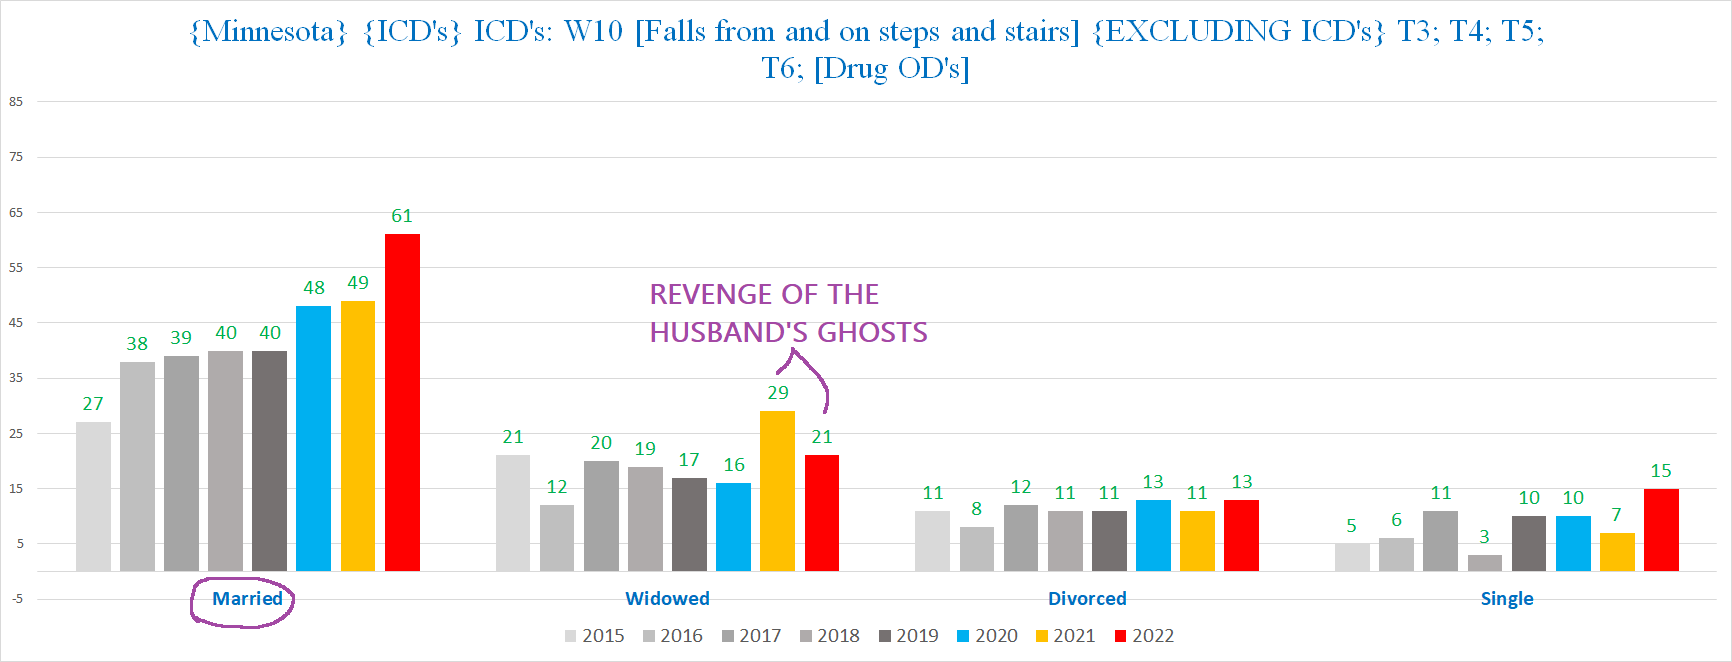
To be fair, perhaps this phenomenon is partly to blame on women getting exasperated with their husbands during the pandemic and. . . well. . . hubby mysteriously takes a headfirst plunge down the stairs - observe how the excess staircase deaths are mostly among married people:
Joking aside, if we redo the age breakdown but restrict it so we only include deaths in men, we get the following:
Here the signal is even more pronounced - for both non-seniors and seniors alike - despite the smaller number of deaths overall.
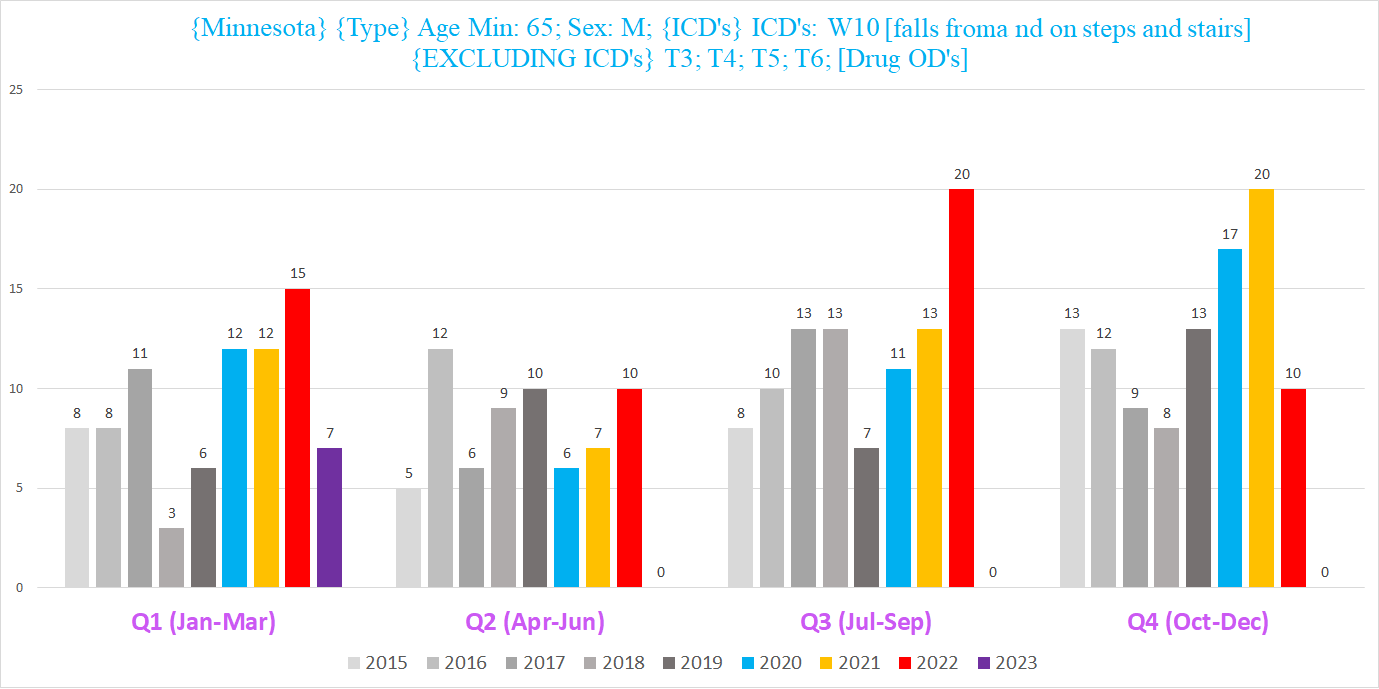
There’s an interesting difference between the non-seniors and seniors when we look at when during the course of the calendar year these deaths are occurring.
This chart shows the breakdown by quarter year for the male senior population (including for the first time 2023 deaths (purple bars), which we have for the first quarter of 2023):
It seems that after reaching a high of 20 (for the 2nd time) in Q3 2022 (red bar), the stair deaths returned to within the normal baseline for the following two quarters - 2022 Q4 & 2023 Q1.
However, for the 30-64 cohort, it is a bit different. The following chart shows the number of staircase deaths per half-year for the 30-64 cohort, with a twist: Each year starts from the October of the previous year - so 2022 H1 is really Oct-Dec of 2021 combined with Jan-Mar of 2022; likewise, 2023 is Oct-Dec of 2022 combined with Jan-Mar of 2023.
(The reason for doing it this way is that in this age group, quarter years have too few deaths to be meaningful in themselves; plus we also want to capture Q1 of 2023 to see if the trend is going up or down; so the solution is to do half-years that combine Q1 & Q4 of each year.)
The winter half years of 2021/22 & 2022/23 - years 2022 & 2023 in the chart (red & purple bars on the lefthand side) - are definitely waaaay up. Even if one year is a fluke, even the most ardent mainstream experts can concede that the likelihood of repeating a “fluke” for a second year in a row is at least somewhat improbable.
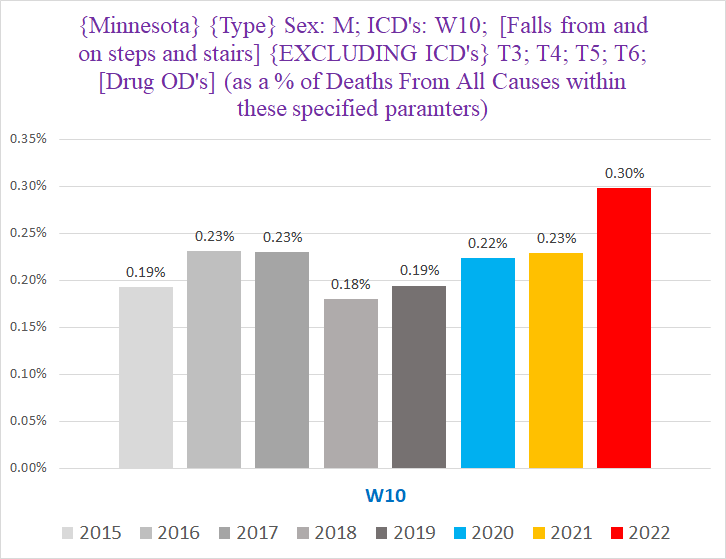
We can also see a potential signal in the change in the % of deaths from any cause in men that are staircase fatalities:
The % of deaths every year that were caused by stairs was pretty stable - until 2023, when it jumped 30% from 0.23% to 0.30%. The change in this % is even more dramatic in the 30-64 age group:
Staircase deaths in 2022 accounted for roughly *double* their normal % of deaths in the 30-64 age cohort.
This is all the more impressive considering that there were a lot of excess deaths in 2022 - meaning that staircase deaths managed to boost their % of the ‘total deaths pie’ that was also larger than usual.2
Staircase deaths that are the UCoD (Underlying CoD)
We can narrow down the parameters even further to only include deaths where the staircase mishap was the UCoD (underlying cause of death) and not a ‘died with’ situation where it was just a background condition -- in plain English, deaths among men where the condition that directly killed the person was caused by the physical accident on the stairs.
So let’s redo these charts for the men focusing on W10 deaths that were the UCoD.
First, here are the total number of W10 deaths for men by year:
There is still definitely something going on in 2022, and probably in 2020 & 2021 as well. So we have a signal for both the increase in falls, and the increase in falls that were so injurious they ultimately killed the ‘fallee’.
Here are the male W10-UCoD deaths by age:
For the 30-64 cohort, the gap between 2022 (red column on the lefthand side) vs all the other years is jarring - 2022’s 18 deaths are *TRIPLE* the normal 6 such deaths per year. That’s a 300% increase in the number of deaths. Making this more significant is the fact that prior to the pandemic, the highest number of W10 deaths in the younger cohort was 7, and there was never a year over year variation of more than 1. Stability over an extended span is a pretty good indicator that any deviation from the norm by random chance is incredibly unlikely. Thus a sudden change of 12 year over year, hitting triple the average norm, is exceedingly unanticipated and therefore significant.
There’s a weak signal in 2020 for the younger cohort & none whatsoever in 2021; for the older cohort, 2020 is near enough to the normal range, and 2021 is too close to read anything into by itself. (Keep in mind that combining the age groups together does produce a bit of a signal for both 2020 & 2021 for UCoD deaths, and combining both sexes shows a clear signal for 2021).
It is fair game to question what precipitated or caused 3x the normal number of fatal encounters with steps and stairs among men between the ages of 30-64. Especially when the women show what the number of deaths “could’ve” or “should’ve” been:
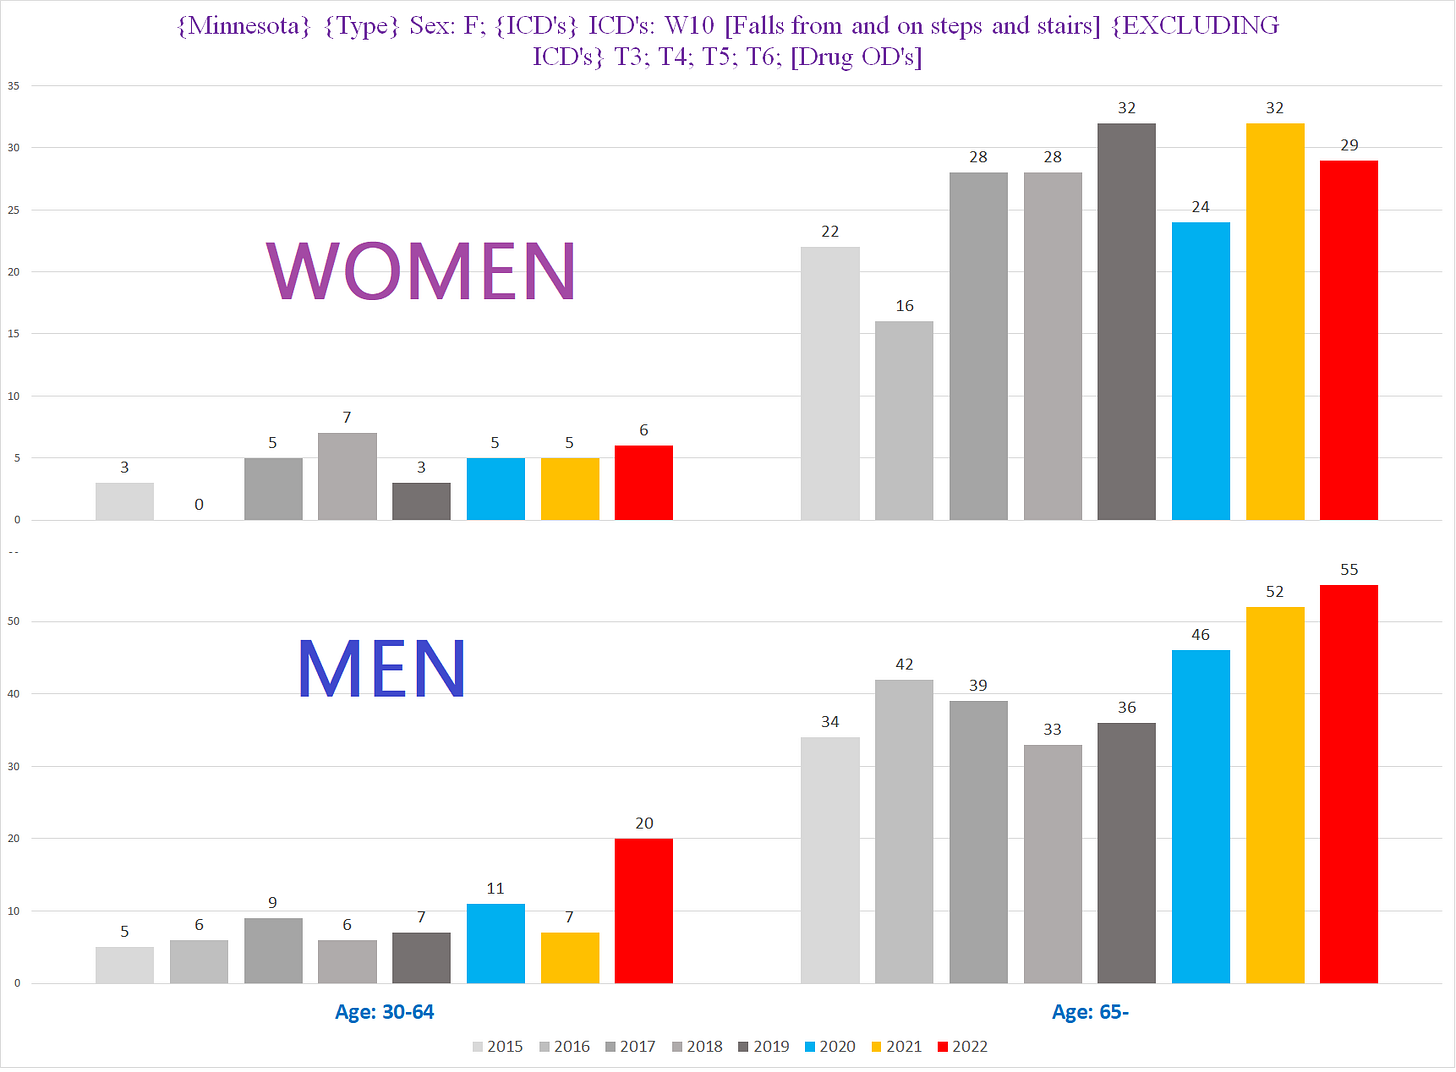
Is this anomalous trend a slam dunk? Nope. But it sure isn’t something that can be summarily dismissed either, especially in the context of the other signals we’re about to discover.
Which brings us to W18 & W19. . .
🥁🥁🥁🥁🥁🥁🥁🥁
W18 and W19 are the “catch all” categories for falls:
W18 = “Other fall on same level”
W19 = “Unspecified fall”
Basically, both of these codes can be used for falls that don’t involve exotic or external factors (refer to W00-W17), and falls where the details of the fall were not provided or available to whomever filled out the death certificate.
If there was an increase in fatal falls from some novel factor -basically people randomly keeling over without anything else involved - this is where you’d expect it to show up.
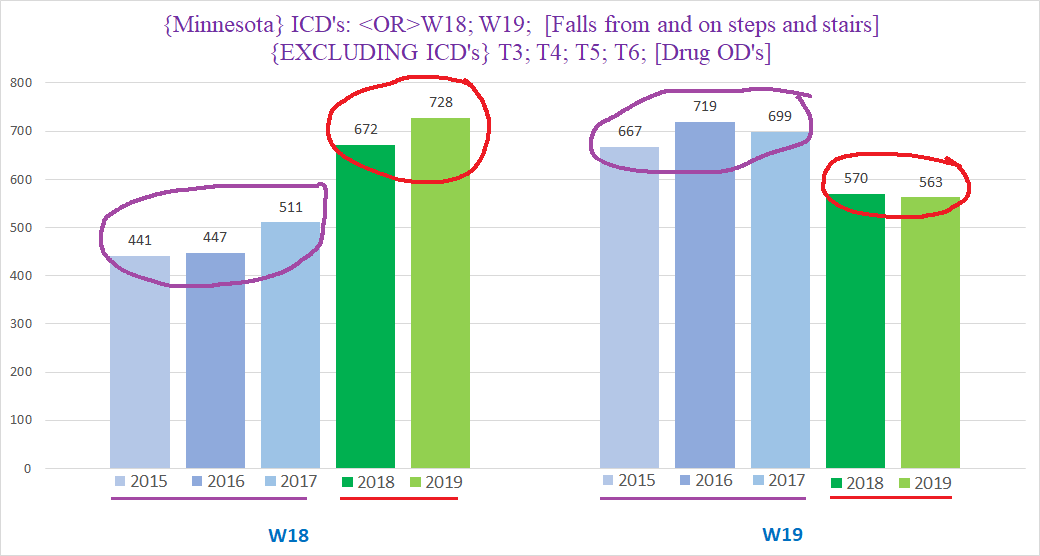
Before we compare the pandemic years to the prior years though, we need to first resolve an oddity about W18 and W19. At first glance, there seems to be something very “off” about W18 and W19 - in 2015-2017 (purple circles), W19 is far more frequent than W18; whereas in 2018-2019 (red circles), it’s the opposite - W18 is more frequent than W19:
Did the profile of falls really change that dramatically between 2015-2017 and 2018-2019? That’s highly unlikely, especially considering that there isn’t a meaningful clinical difference between the falls covered by W18 vs those covered by W19.
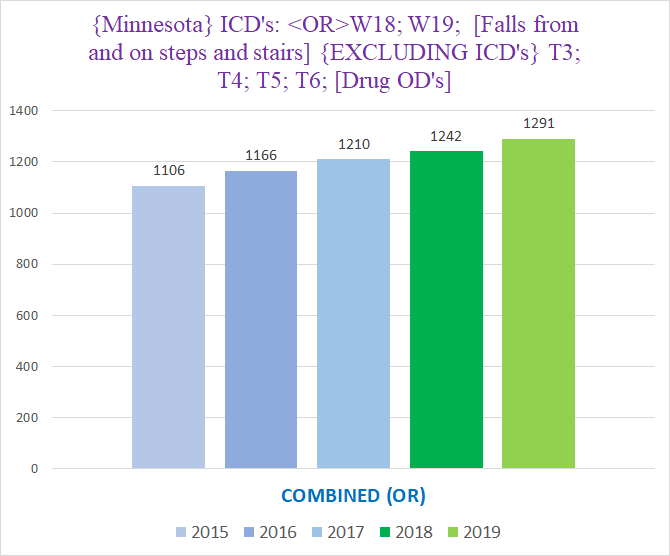
If we combine W18 & W19, we can see what happened:
Notice how much smoother / flatter the columns have become when we combine W18 & W19, now showing a stable trend from 2015-2019 where there’s a year over year increase of about 30-60 deaths.
What apparently transpired is that the CDC changed something in their algorithm between 2017 and 2018 that caused W18 to get a larger % of the “plain” falls without details instead of W19 than it had before the algorithm change. (Remember the CDC is responsible for assigning ICD codes to the CoD’s described on death certificates.)
Thus we’re going to work with the assumption that for clinical/epidemiological purposes, W18 & W19 are really a combined category that represents the falls that don’t fit into one of the categories of falls captured by codes W00-W17.
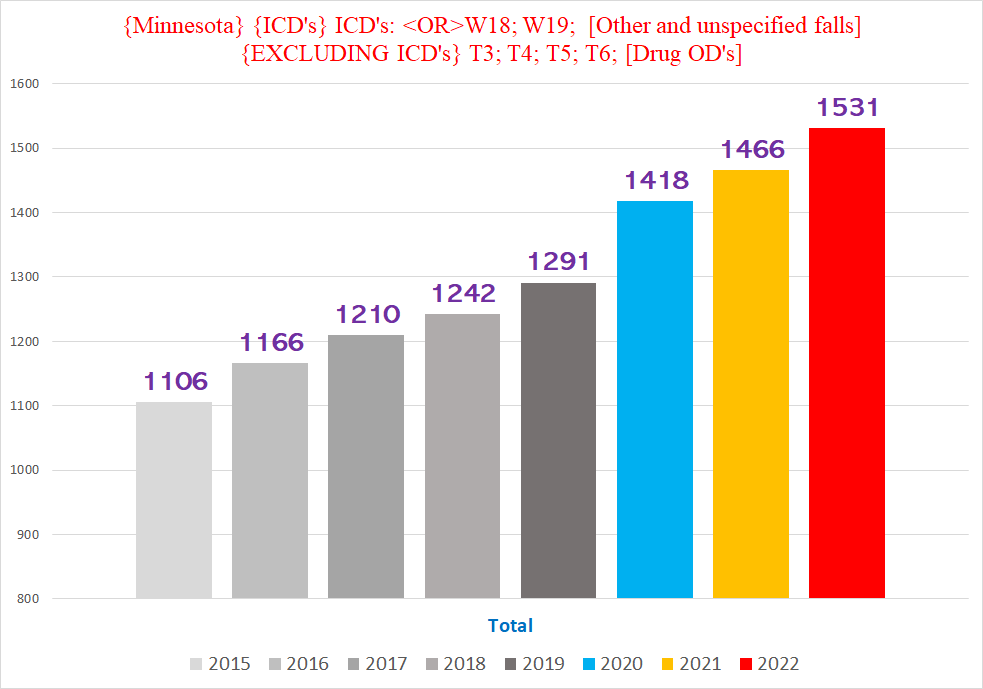
With that resolved, here is what the pandemic years look like compared to the prior years:
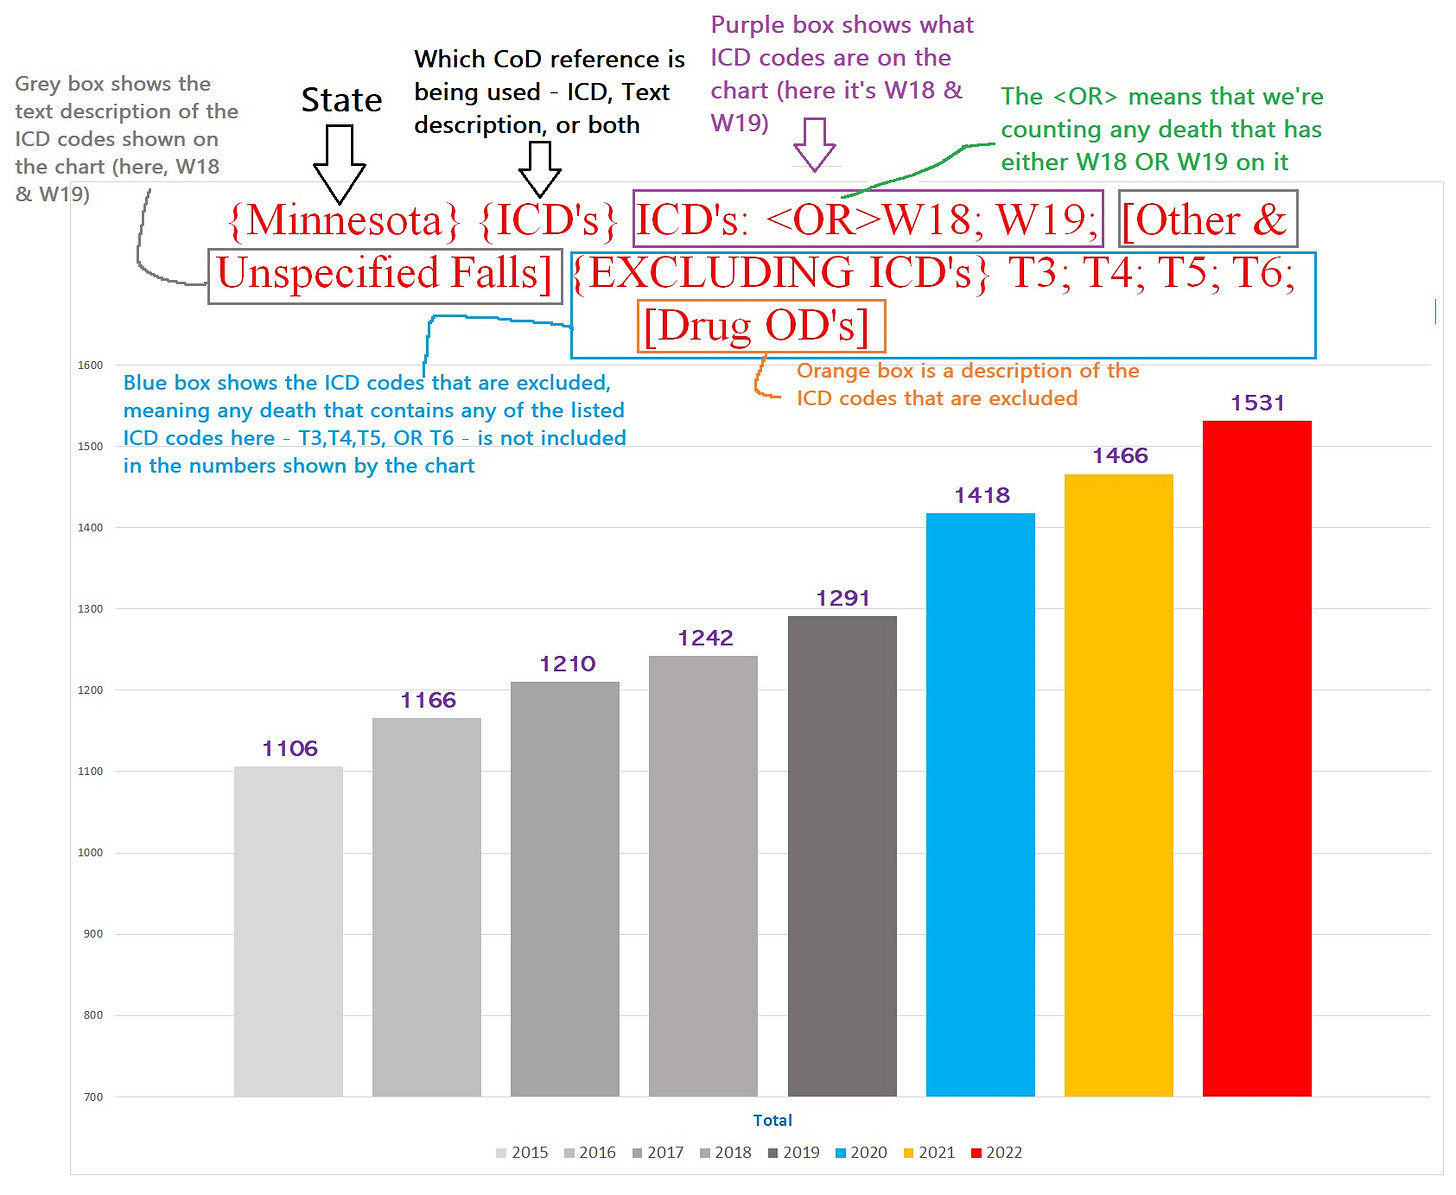
Even without narrowing the parameters such as gender or age, all three pandemic years are well above the trendline from before the pandemic (green arrows point to the expected # of deaths predicted by the trendline of 2015-2019; orange arrows point to the actual # of deaths that occurred in each of the pandemic years):
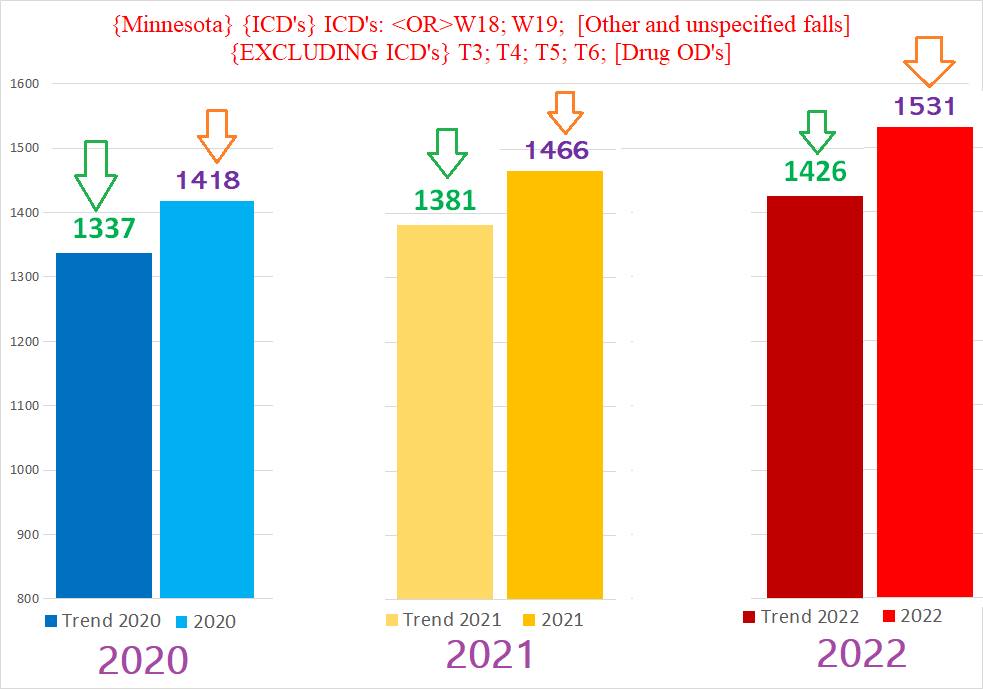
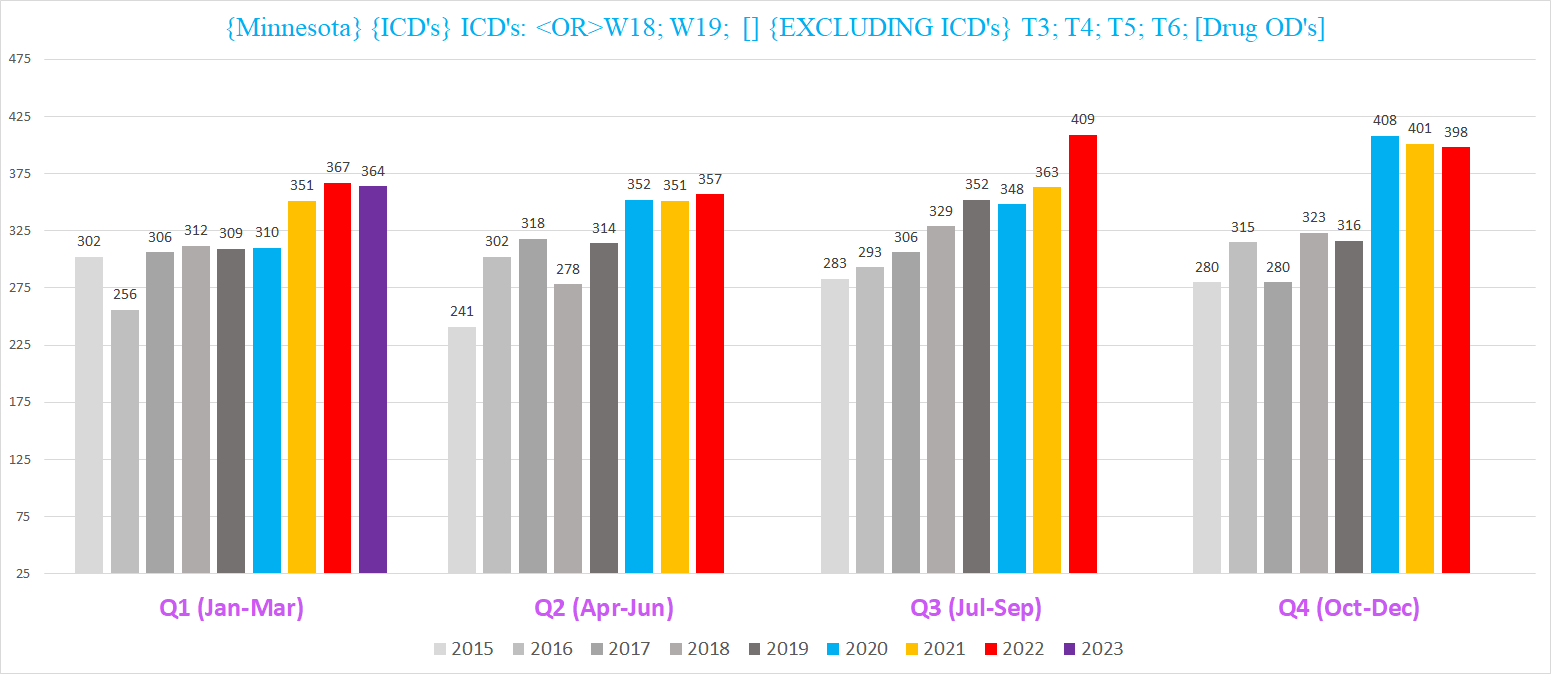
Since there are well over 1,000 such deaths in the pre-pandemic years - and about 1,500 during each of the pandemic years - we can look at the distribution of these deaths throughout the year (the purple bar with ‘364’ on the right in the Q1 bars is for 2023 Q1):
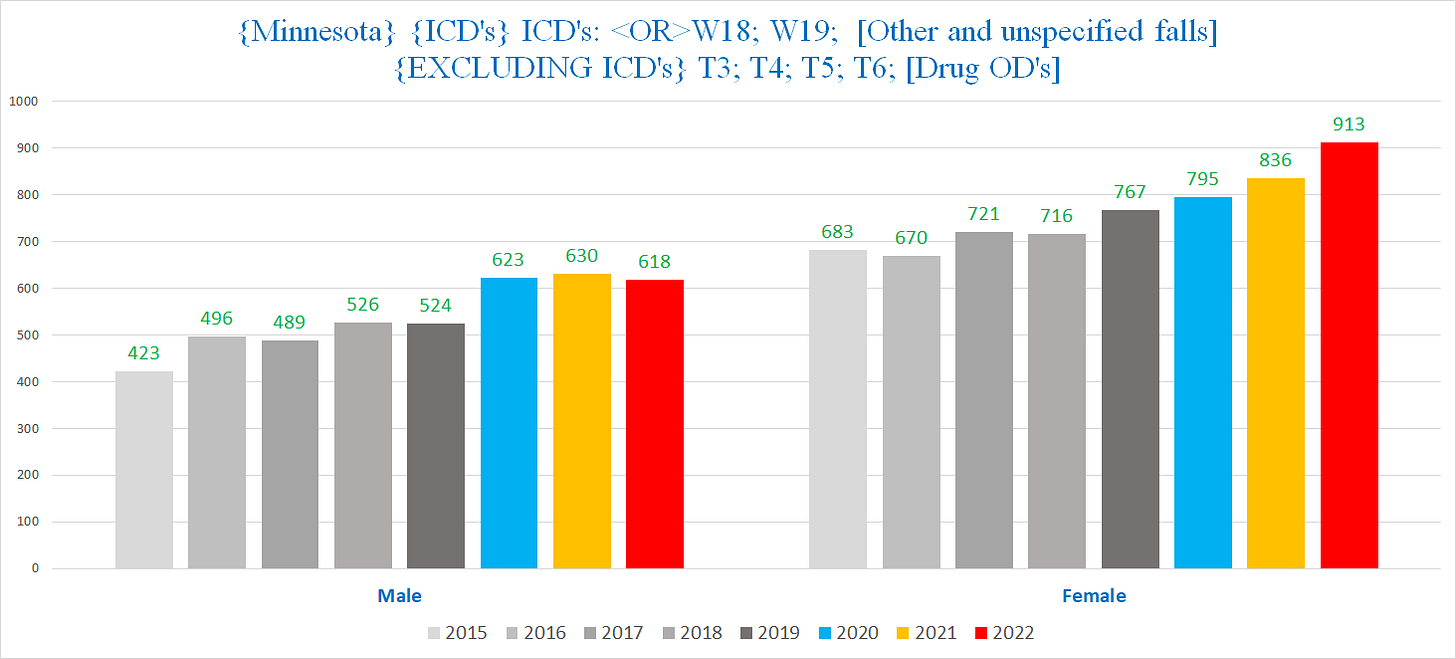
Unlike fatal staircase fiascoes, both sexes see an increase in deaths involving unspecified falls during the pandemic years, but with different trendlines, so we’ll look at each sex individually - we’ll discuss the men below, and save the women for Part II:
Male W18 / W19 Deaths
The male side is more obviously in excess, because the pre-pandemic trend is pretty flat and all three pandemic years easily eclipse the pre-pandemic trend.
Here are the men’s W18 & W19 deaths by age (note: the graphs are drawn with different Y-Axes, in reality there are >10x deaths in the seniors than in the non-seniors) - unlike the staircase deaths, here there isn’t a clear increase in deaths involving unspecified falls for the non-senior male population (lefthand chart), but a clear increase for the the seniors (righthand chart):
When we break out the seniors by quarter year, we see the following:
There is clear excess deaths in the winter spanning Q1 & Q4 - a.k.a. Flu season - for all three years (2020 Q1 was before the pandemic / pandemic policies broke out). 2020 Q2 has probable excess in Q2, and 2022 Q3 is head and shoulders above any other year’s Q3.
Similar to the 30-64 cohort for staircase fatalities, 2023 Q1 for the male seniors set a new record for most W18 / W19 deaths in a Q1 for any year. Furthermore, 2022 Q3 - the last Q3 to date - also set a record for Q3 deaths for any year. 2/3 of the most recent quarters setting new record highs for W18 / W19 deaths makes it seem like this trend is accelerating.
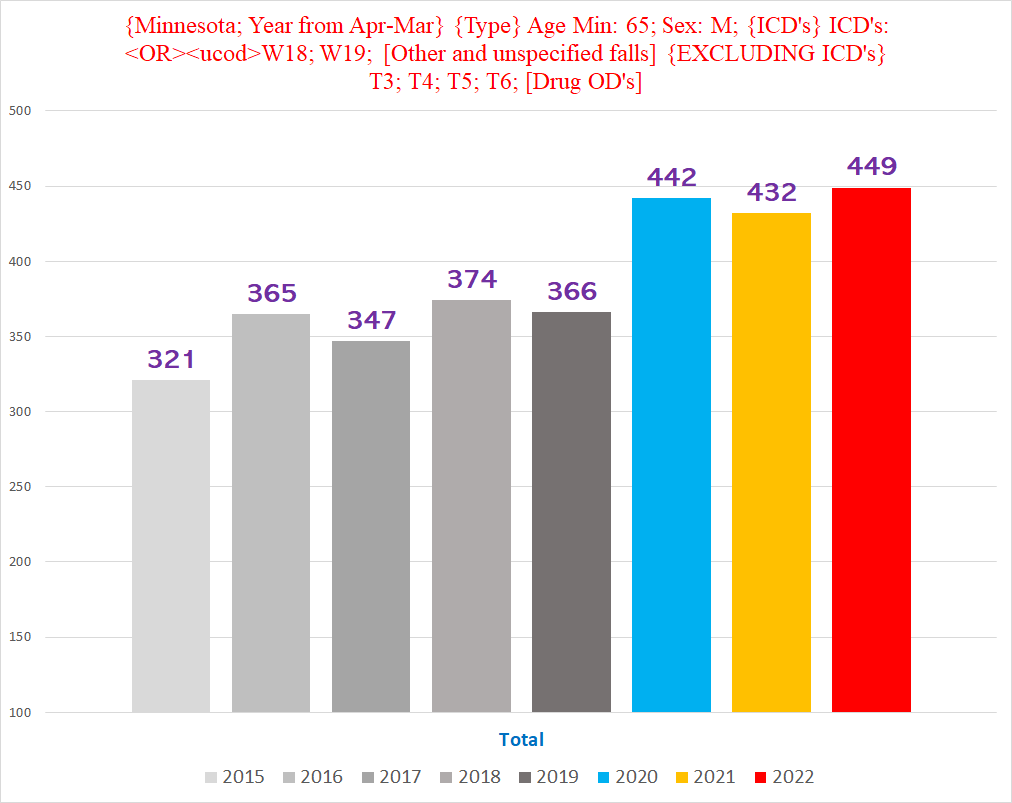
If we look at senior male W18 / W19 deaths that are UCoD’s - think died because of the fall vs died because of something else that the fall helped to aggravate - we get the following:
Three years in a row well above anything from prior years suggests that this isn’t some fluke or blip, but a sustained anomaly of some sort.
Interestingly, if we start each year from April (so it gets Jan-Mar of the next year too), we get a smoother trend that accentuates the excess W18 / W19 UCoD deaths during the pandemic:
Another point accentuated by shifting the years forward 3 months is that for male seniors, there is a jump in 2022 in the % of all deaths where the UCoD was W18 / W19 to 0.9% of all deaths -- this despite the substantial overall excess mortality for 2022 / 2023 Q1:
The comparatively lower % from 2021 and 2020 are likely a function of the higher raw number of deaths in the 2020 & 2021 years beginning in April than there was in the similarly offset 2022:
(For the record, the magnitude of the 2022 excess shown here is larger than would appear from the height of the red bar, because of the “pull-forward effect” that the previous years of excess mortality exerts on 2022, which is a subject for another time.)
Put differently, the lower number of total deaths for the staggered 2022 year helps to highlight the excess W18 / W19 deaths - since there are less overall deaths, an increase in the W18 / W19 deaths comes out to a larger % of total deaths. (And remember, there are still excess deaths in 2022.)
*************
Clearly, there has been a sustained unexpected increases in deaths involving falls that is implausible to attribute to random chance or to covid itself. At any rate, public health officials sure have a lot of ‘work’ to do.
We’ll (hopefully) get to the women’s W18 / W19 deaths, plus other types of accidents, in future articles.
To illustrate with simple numbers, suppose that there are 100 deaths every year, 2 of which are from staircase accidents = 2%. If one year there were 4 staircase deaths out of the 100 total deaths, the % of deaths that are from stairs would be 4%. But if in the year where there were 4 staircase deaths instead of 2, the total number of deaths went from 100 to 150, then the % of deaths that are from the stairs would only be 3.25%.








Can we all stop saying "the pandemic" and start saying "the Atrocities"?
Is there some kind of variance for death statistics? For example, if 100 people die in a year, how certain are they that they know the exact cause for every death? Could there be multiple causes? Can we even trust the people filling out death certificates anymore? Maybe if you feed that data into some A/I machine, it would come out smelling like a rose.
After seeing a list of the new laws that have been put into place during 2023 in Minny, I would think many people would be tripping over each other trying to get the heck out of Dodge. Gruesome, I think.