Nevada's Pandemic of Falls & Blunt Force Traumas
That began in 2021, not 2020
I apologize for not publishing much over the past month. Between four holidays, job hunting, and multiple major projects I have been pretty occupied. I also have a lot of relatives living in Israel, and ended up spending a decent amount of time this past week trying to explain to people some critical background information necessary to understand what is going on over there right now.
We recently obtained the death certificates from Nevada going back to 2015, albeit with much more limited information compared to the death certificates from MA, MN or VT that we already have. At least for now, we only have the text Causes of Death, ICD Codes (although a bunch of death certificates are missing them for some reason), sex, date of birth, date of death, and county of death for each death certificate.
Nevertheless, we can still glean some useful information even with these constraints. Just bear in mind that the mortality trends would look a lot worse if we could see a more granular picture like we are able to with the other abovementioned states.
This article discusses some preliminary observations.
All-Cause Mortality
Before getting to the specific mortality trends concerning physical trauma deaths, it is instructive to contextualize it at least a little against the backdrop of all-cause mortality in the state.
Total # of deaths / year
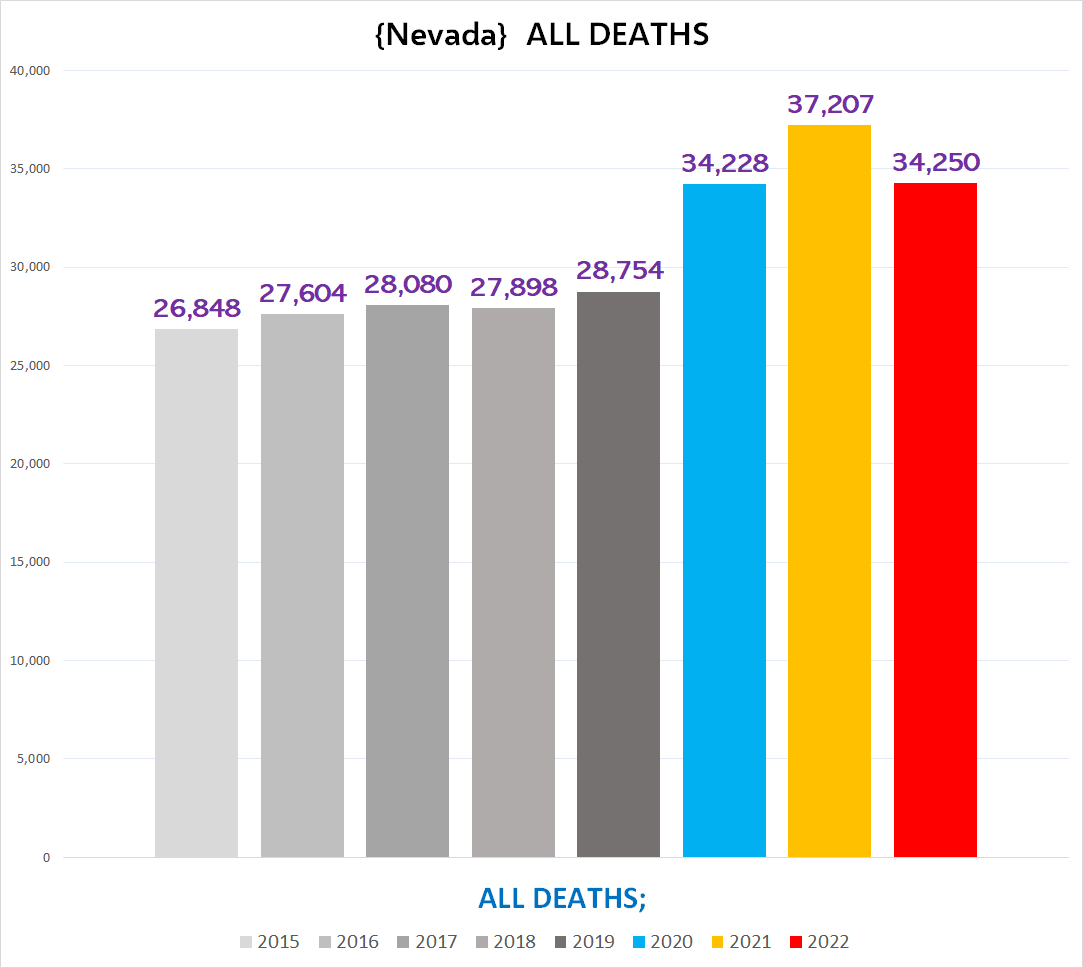
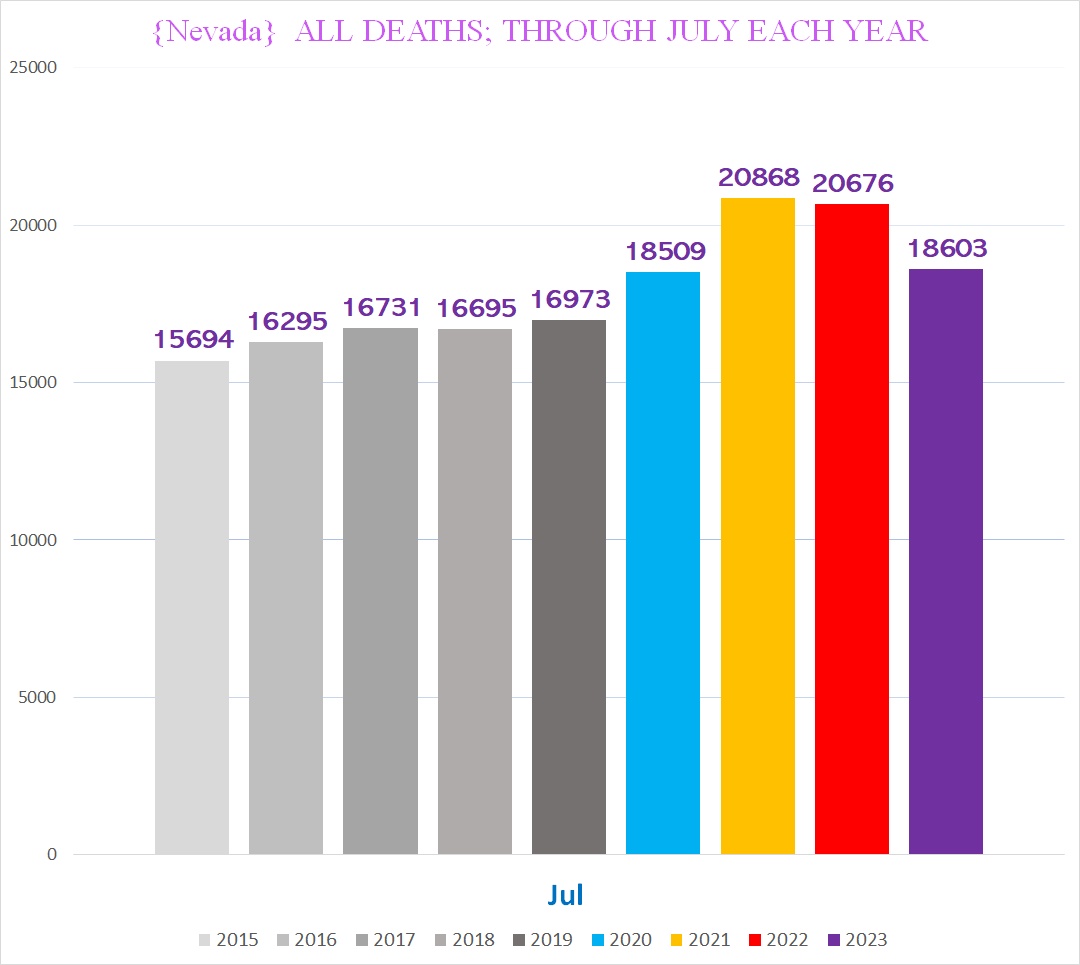
The following two charts show the total number of deaths in Nevada by year (top) and the total number of deaths through the end of July for each year (bottom):
Deaths / 100K each year
The following chart shows the # of deaths/100K for the entire state of Nevada:
Population estimates from Census Bureau (2019 estimate is the median of 2018 & 2020 for 2019, because they didn’t have 2019 estimates)
https://www.census.gov/data/datasets/time-series/demo/popest/2010s-state-total.html
There were more deaths in both 2021 and 2022 compared to 2020. Moreover, the raw totals are still above the pre-pandemic baseline even in 2023, despite what should be a very substantial mortality *deficit* after *three* consecutive years of mounting excess deaths (!!!).
Deaths Involving Blunt Force Trauma / Falls
AKA, physical accidents.
**Note: For all charts, deaths where the Underlying Cause of Death was a drug or alcohol overdose/poisoning are excluded to prevent the spike in OD deaths from distorting the mortality trends.**
We noticed that in the other states we looked at, there was substantial excess deaths involving physical accidents that began in 2021.
For instance, in Vermont, deaths involving “blunt*trauma” went spiking to nearly 50% excess, and then more than *DOUBLED* from 2020 to 2022 (!!):
I previously wrote about this (including a basic introduction that might be helpful for this article as well):
Nevada deaths involving physical trauma accidents
One of the quirks in the Nevada death certificates is that a number of them do not have the ICD codes included for some reason (we are still trying to find out why). Thus it is prudent to look at the text descriptions of the Cause/s of Death (CoD).
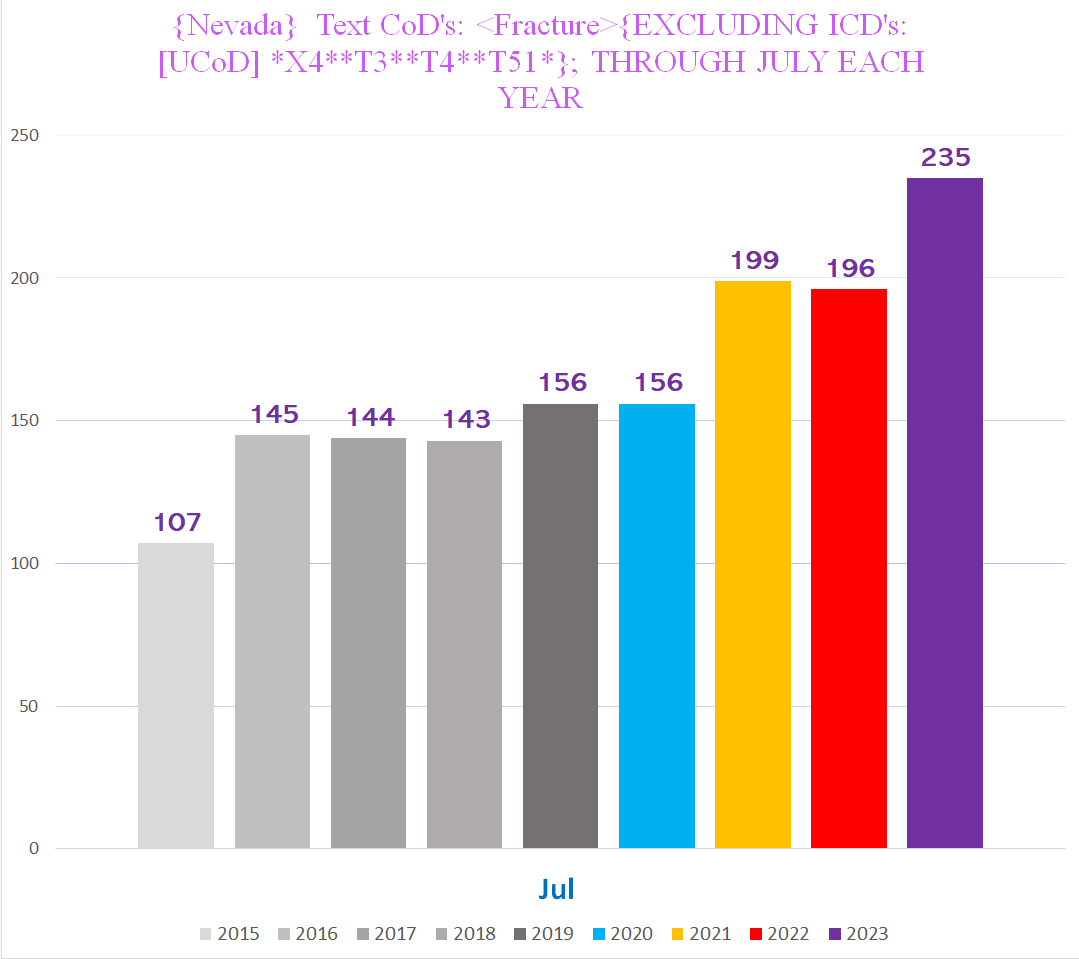
Deaths involving a “Fracture”
The following chart shows the total # of deaths where the death certificate contains the text “fracture” in at least one of the CoD’s identified on the death certificate:
Clearly, something looks a bit fishy in 2021 & 2022. (The 2015 “deficit” we will get to later.)
However, it is 2023 where this trend goes BOOM, as the following chart showing the total # of such deaths through JULY each year illustrates:
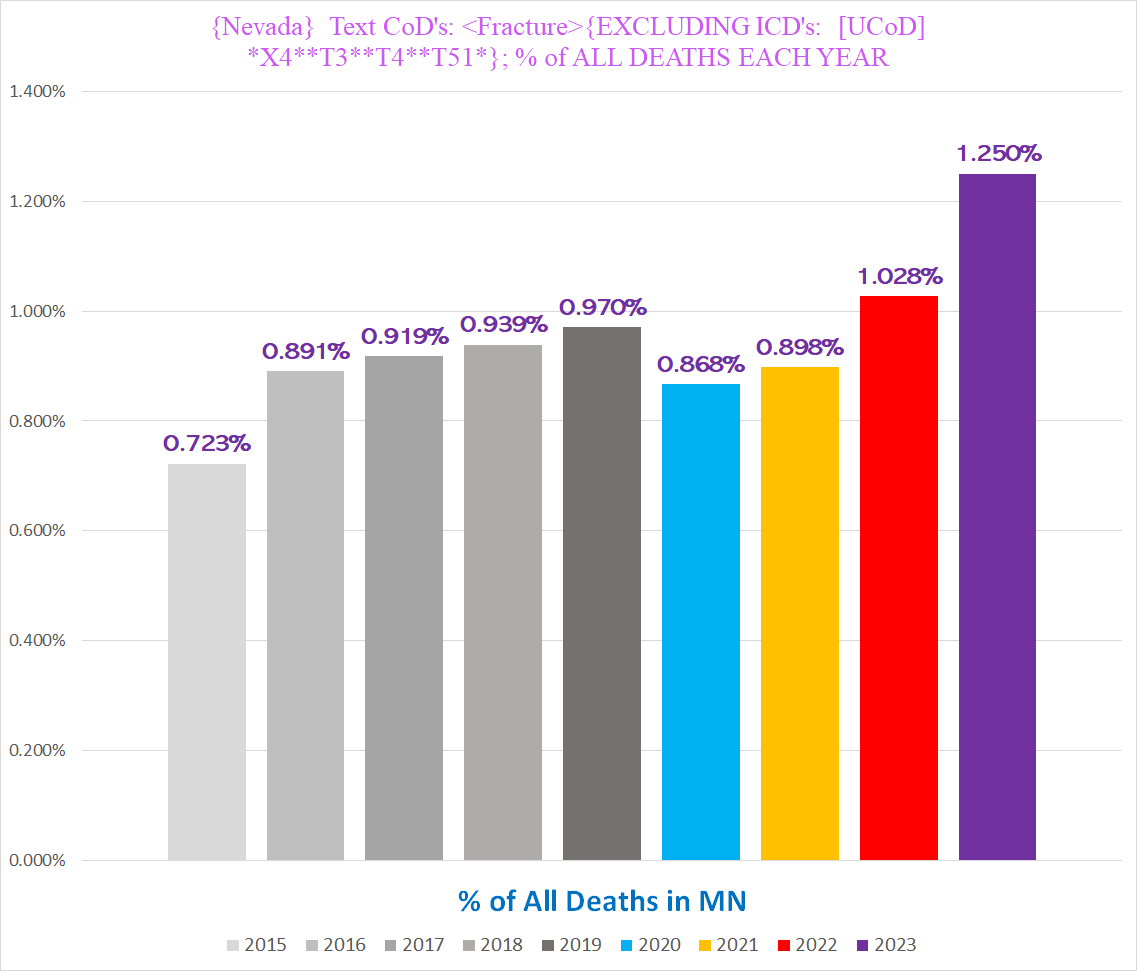
The explosion of fracture fatalities in 2023 is also reflected in the % of all deaths each year that involve a “fracture”:
Note: The lower than normal %’s in 2020 & 2021 do not in themselves indicate that there was no excess deaths involving fractures, because it could be that the % is artificially depressed by the substantial amount of excess deaths from other causes.
Fracture deaths seem to really take off beginning in the middle of August 2022 (highlighted by light blue trendline at the right side of the chart below). The following chart shows the 3-week average of fracture deaths (red) and covid deaths (purple; bear in mind that ‘covid deaths’ are simply any death certificate that has the U071 covid ICD code):
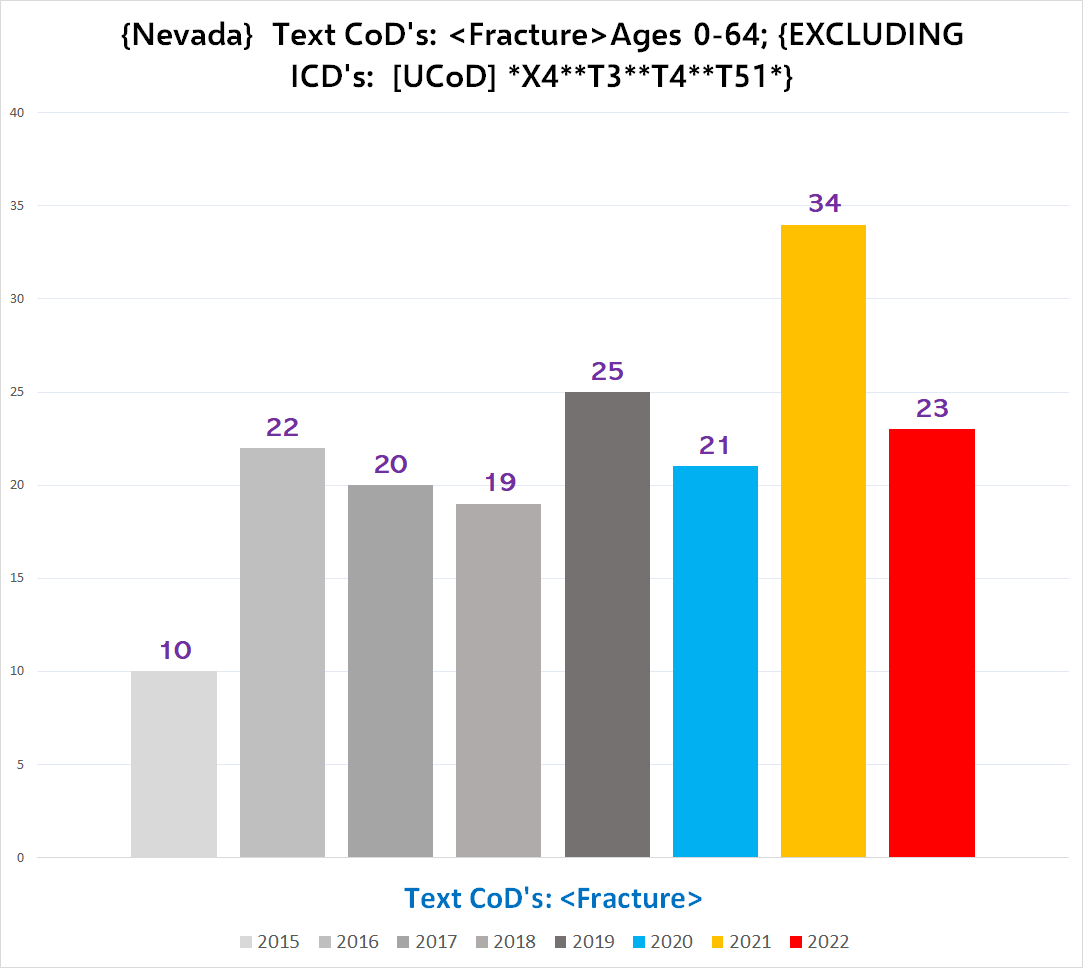
Curiously, if we look at fracture deaths in non seniors - ages 0-64 - 2021 is the outlier year:
Deaths involving “Fall/Fell”
Next up, we have deaths involving falls. The following charts show, for deaths where the death certificate contains either the word “fall” or “fell” in at least one of the CoD’s identified on the death certificate, the total # of deaths (top); total # of such deaths through JULY each year (middle); and the % of all deaths each year that involve a “fall/fell” (bottom):
Unlike deaths involving fractures, deaths involving falls spike in 2021 but not so much in 2022 or 2023 (so far).
Notably, the 2015 ‘deficit’ seen in fractures is also present in falls.
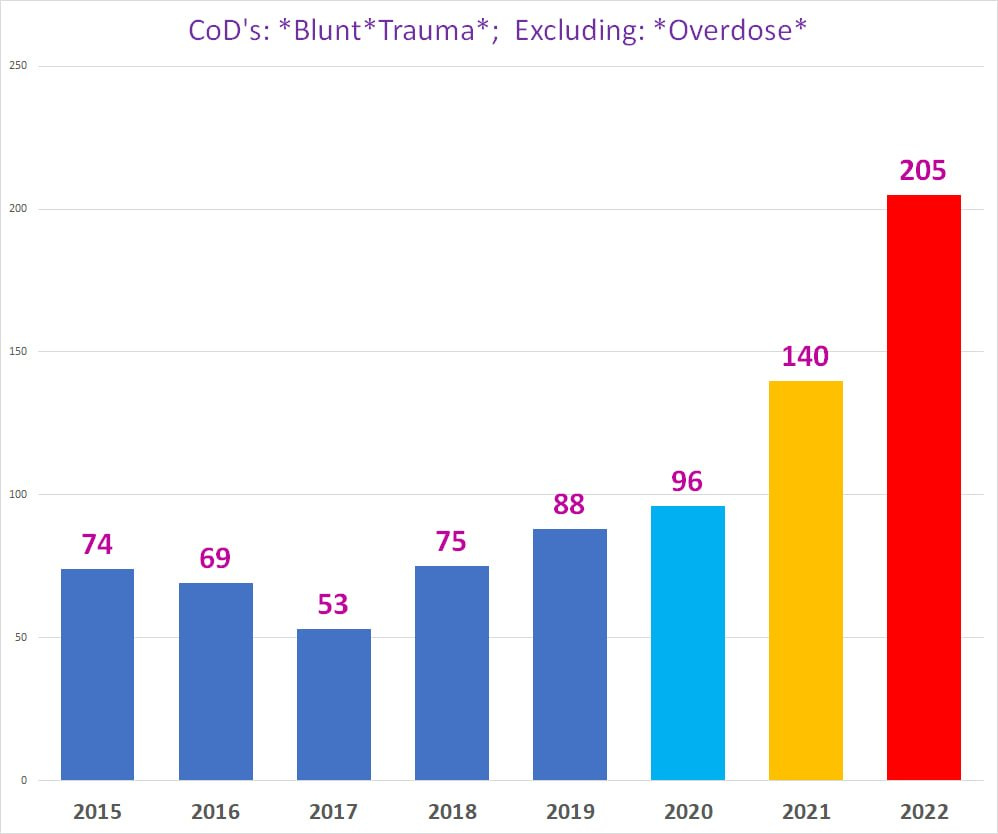
Deaths Involving Blunt Trauma
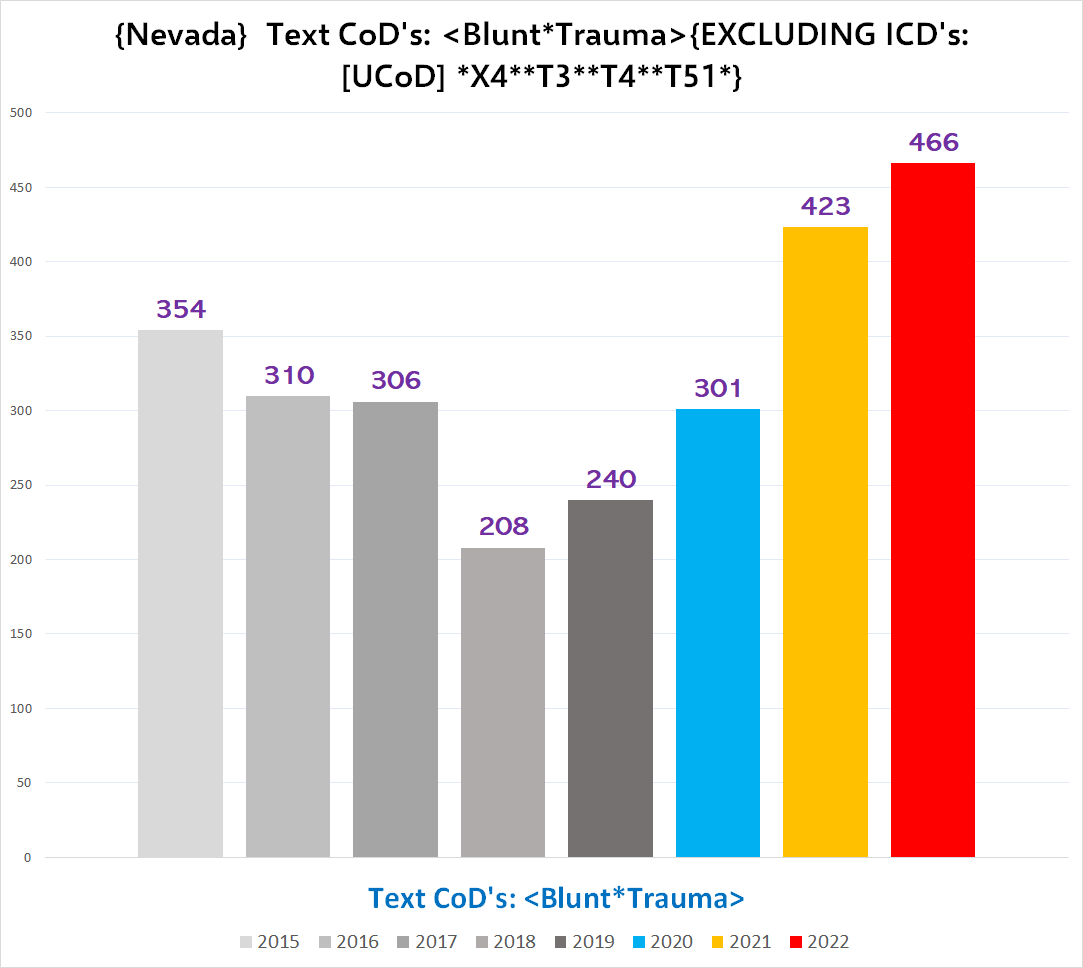
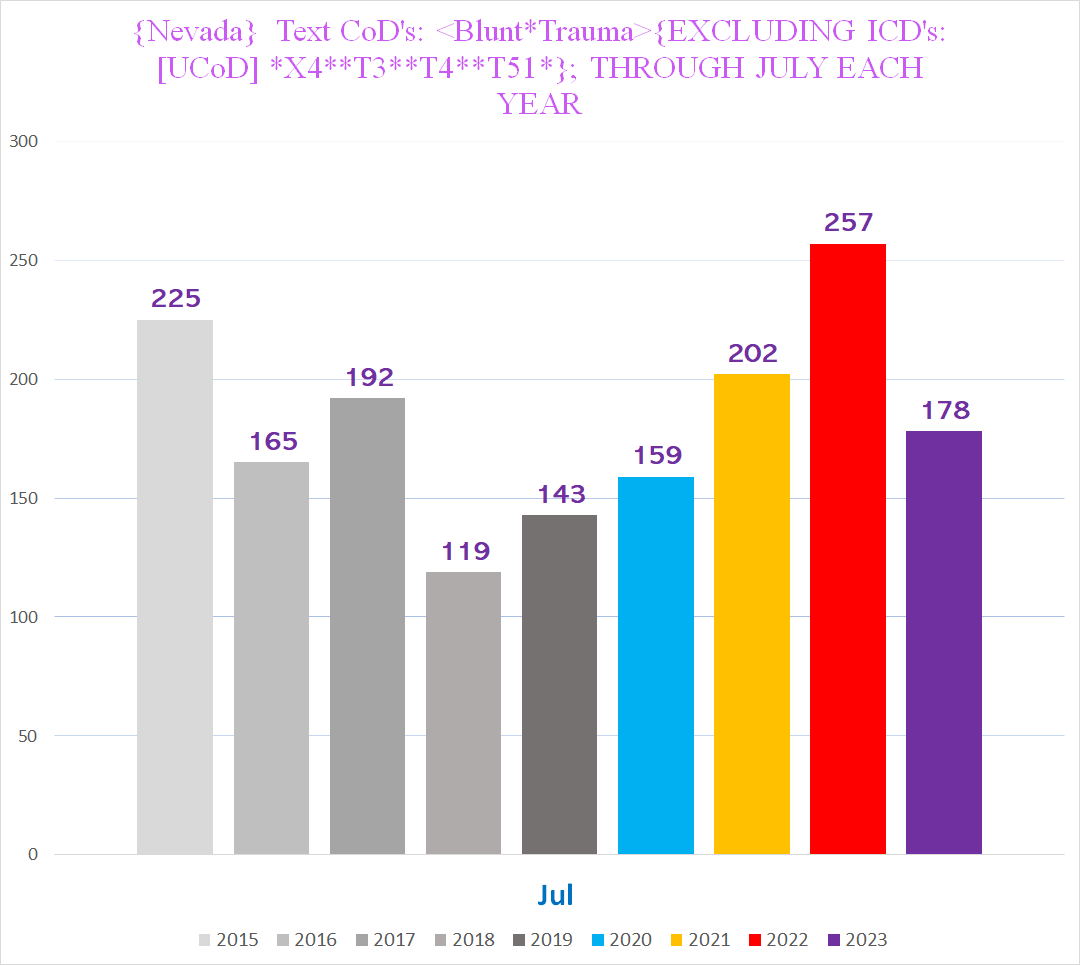
The following charts show, for deaths where the death certificate contains either the words “Blunt” AND “Trauma” in at least one of the CoD’s identified on the death certificate, the total # of deaths (top); total # of such deaths through JULY each year (middle); and the % of all deaths each year that involve a “fall/fell” (bottom):
These charts speak for themselves, clearly there is excess deaths involving “blunt trauma” in 2021 & 2022.
There is another critical observation here though - 2015 (and to some degree 2016/2017) is wildly above the other years.
Combining Falls / Fractures with Blunt Force Traumas
Since it is very unlikely that 2015 had a markedly higher incidence of deaths involving blunt trauma, or that 2015 had a markedly lower incidence of deaths involving falls or fractures, the likely interpretation is that starting in 2016, doctors started using the language of “fracture” or “fall” in place of “blunt trauma”.
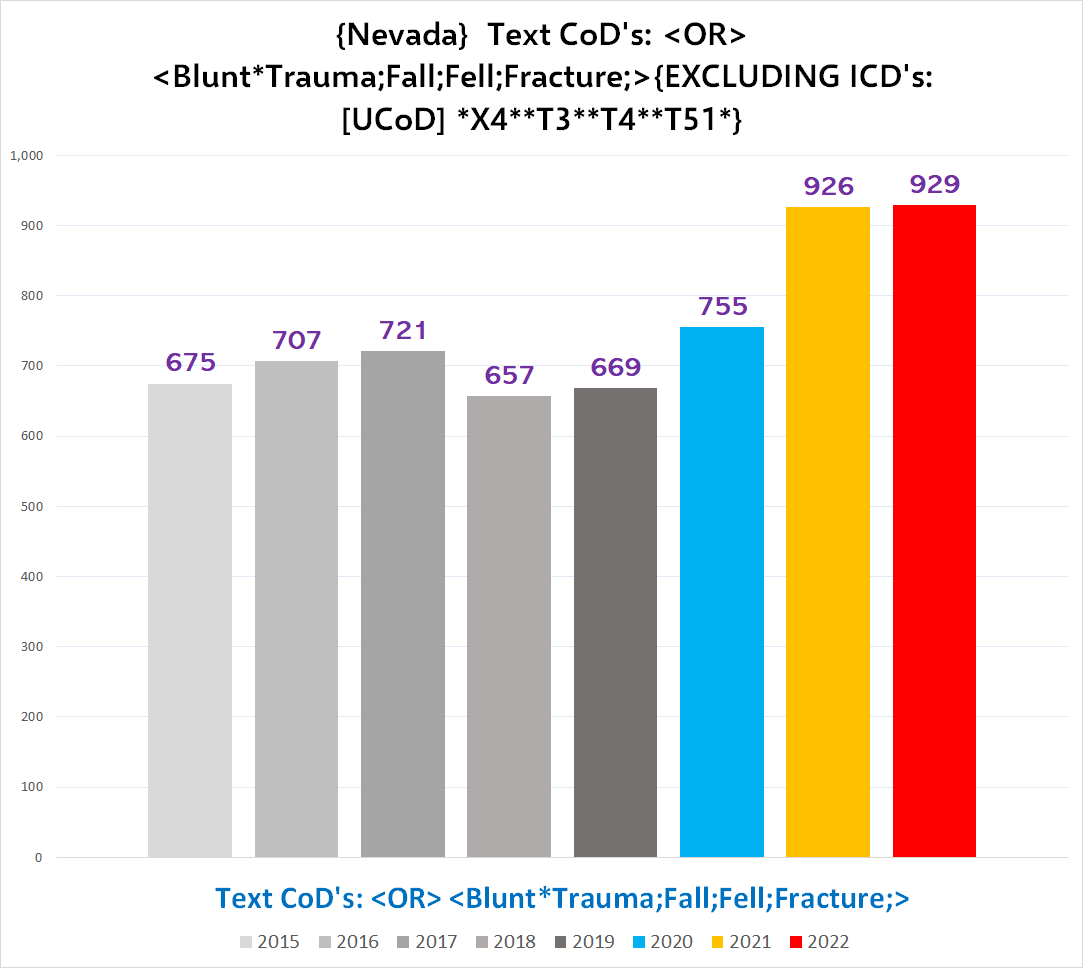
Thus, in order to see a more accurate & stable trend in traumatic physical accidents that don’t involve other external factors such as machinery or car crashes, we can combine them into one category of ‘deaths containing either “fall” / “fell” / “fracture” / “blunt trauma” in at least one CoD’:
You can see how the basic trends are far more stable from 2015-2019 when you combine these various text descriptors.
However, now there is an odd dip in 2018 & 2019. I filtered out all the death certificates represented in the above charts, and discovered the following very bizarre anomaly highlighted by the following chart showing the total # of deaths where the word “vehicle” appears in at least one CoD on the death certificate:
Did deaths involving “vehicles” really go down by two thirds from 2015 to 2019?
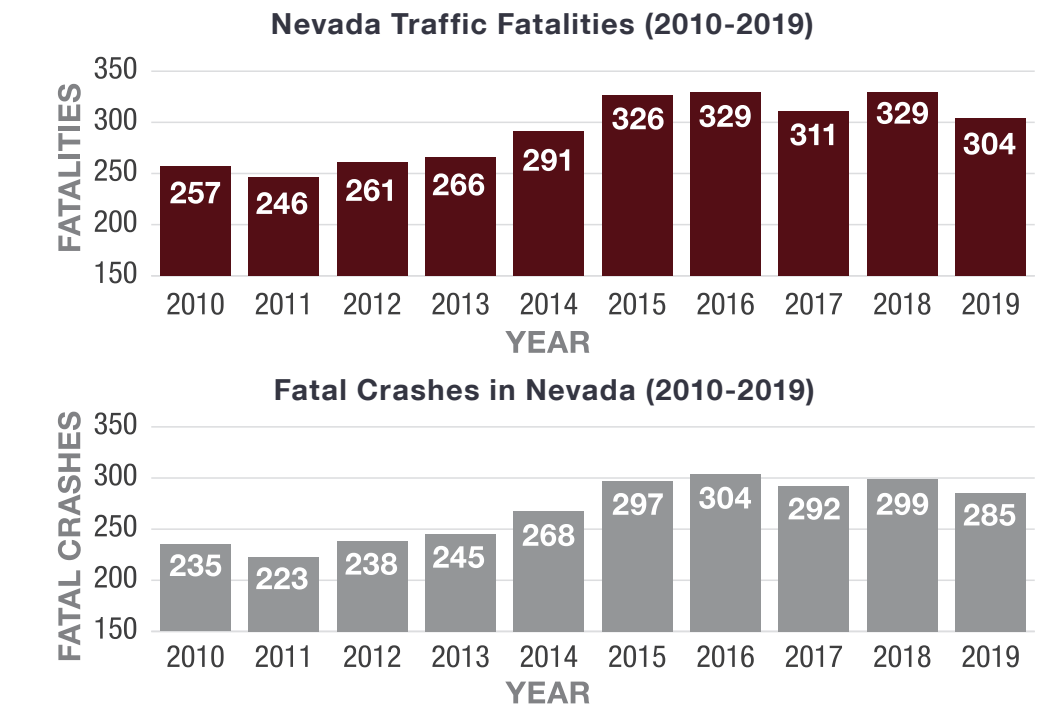
Just to be sure, I did a cursory Google search for Nevada traffic fatality data which turned up the following:
So no, there was no precipitous decline in vehicular victims in Nevada.
Because I have not yet been able to figure out where the missing auto fatalities from 2016-2019 have disappeared to, I re-ran the combined Fall/Fracture/Blunt Trauma query, excluding the following words that are typical descriptors when a vehicular misadventure was the culprit:
“Vehicle”
“Motor”
“Pedestrian”
“Collision”
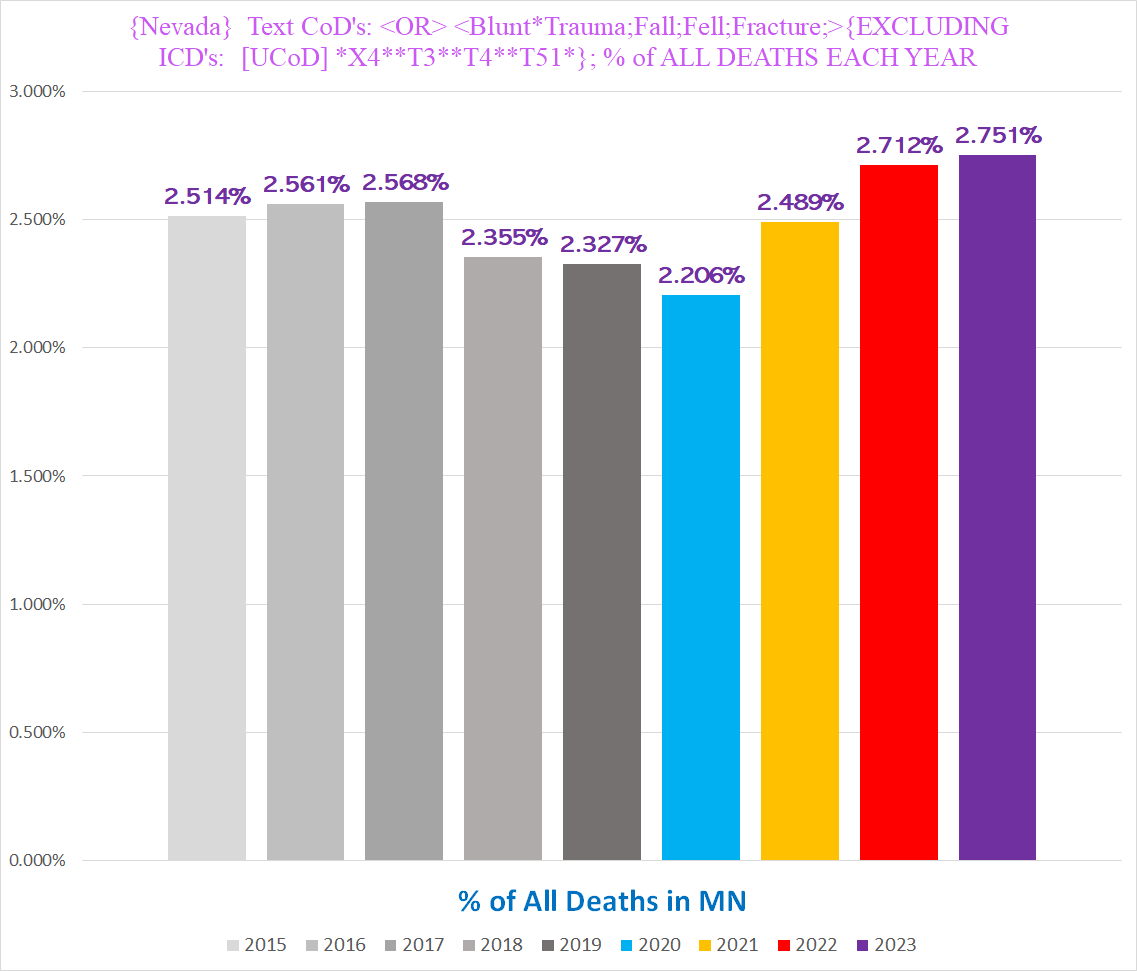
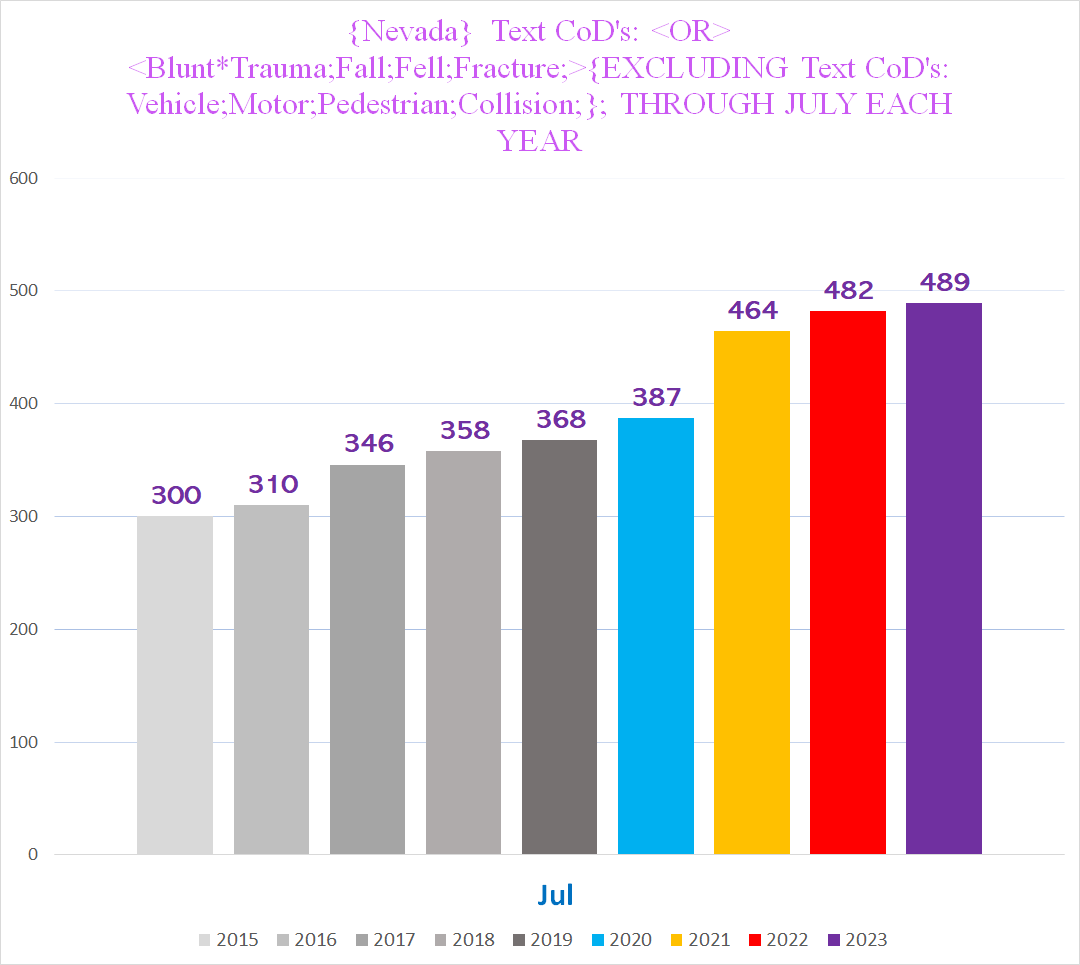
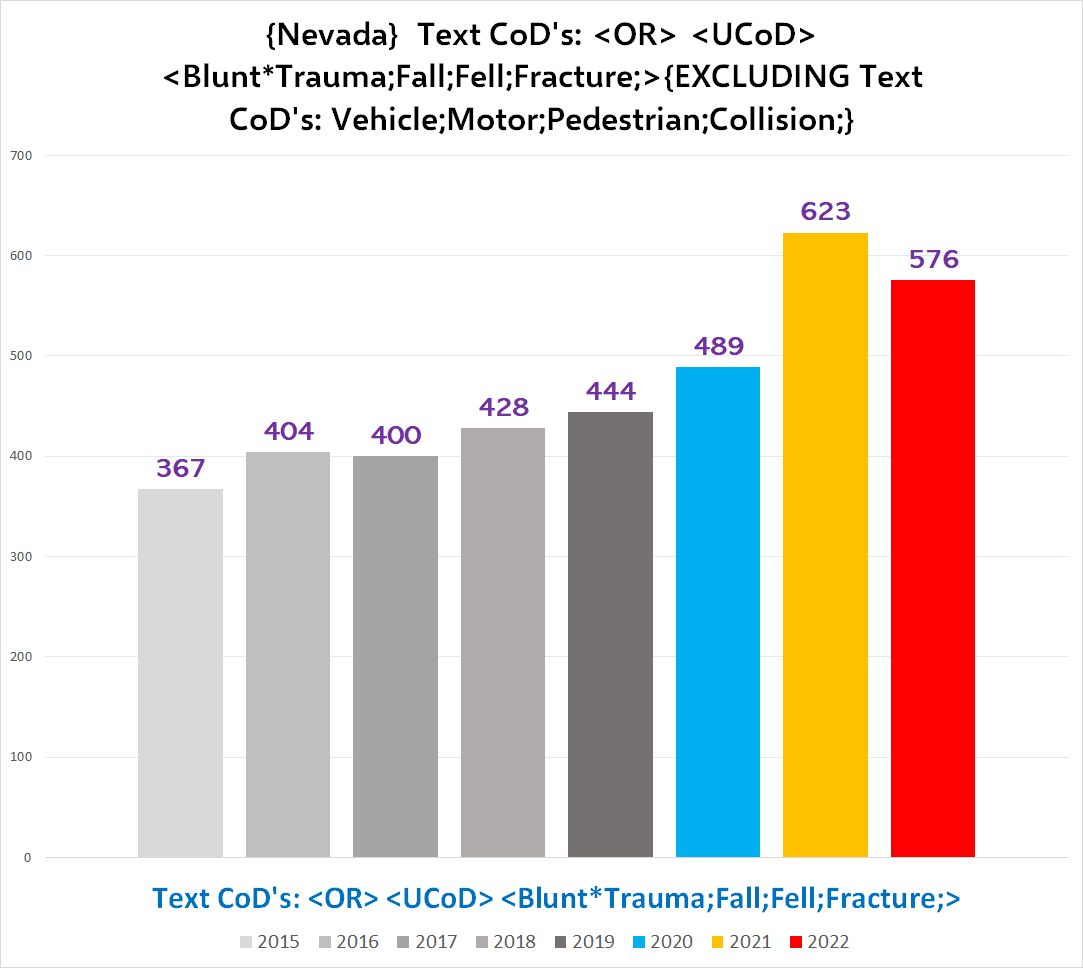
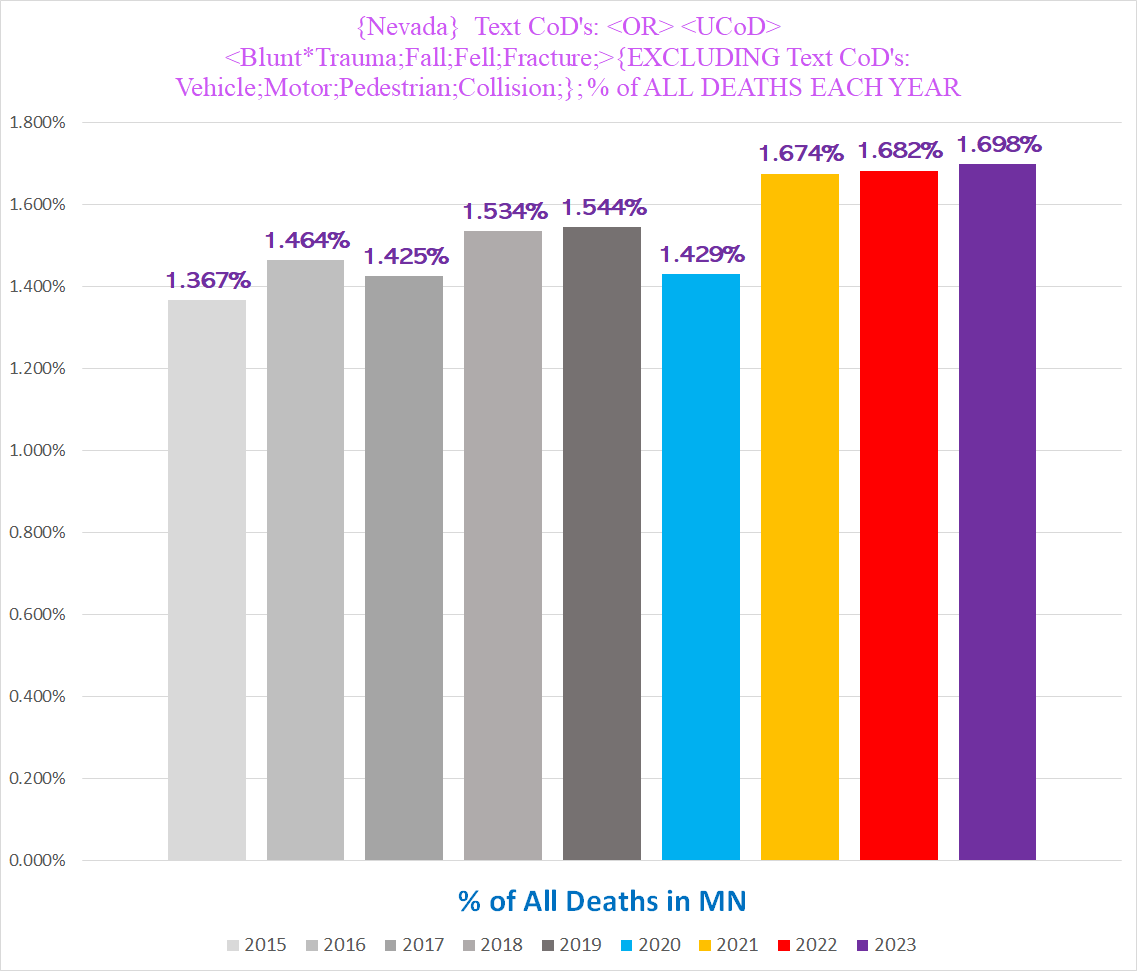
Here are the results when death certificates containing any of these four words are excluded - and boy do these charts paint a disturbing picture for 2021-present:
Total # of deaths with text of either Blunt Trauma / Fall / Fell / Fracture
Total # of deaths through JULY with text of either Blunt Trauma / Fall / Fell / Fracture
% of all deaths through with text of either Blunt Trauma / Fall / Fell / Fracture
Now we can see a remarkable degree of excess mortality from deaths involving non-vehicular physical traumas that starts in *2021* and continues through 2022 and 2023.
Underlying Cause of Death [UCoD]
This trend holds when we only look at deaths where the blunt trauma / fracture / fall was the UCoD - meaning that it wasn’t incidental to excess deaths caused by something else (like covid for instance).
Here are the same charts as above, showing only the deaths where the blunt trauma/fracture/fall was the UCoD:
Total # of deaths with text of either Blunt Trauma / Fall / Fell / Fracture in the UCoD
Total # of deaths through JULY with text of either Blunt Trauma / Fall / Fell / Fracture in the UCoD
% of all deaths through with text of either Blunt Trauma / Fall / Fell / Fracture in the UCoD
Breakdown by Age & Gender
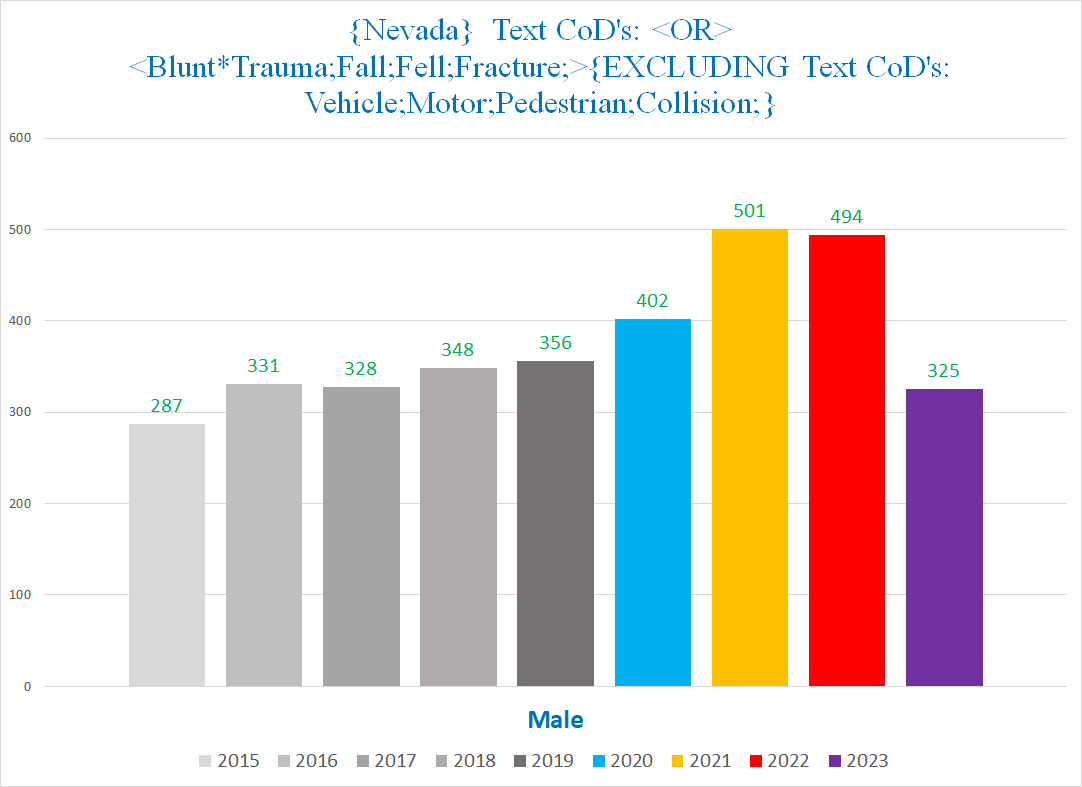
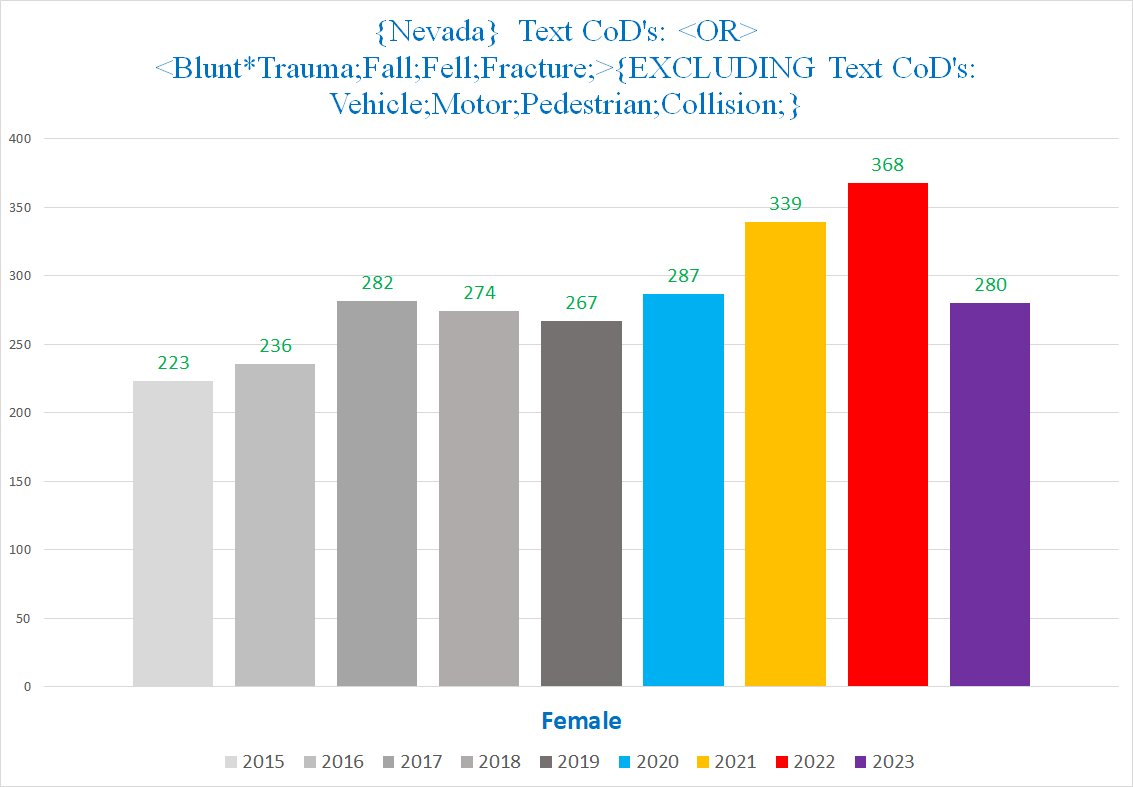
Gender
The following charts show the total number of deaths for men (top) and women (bottom) that contain either Blunt Trauma / Fall / Fell / Fracture in at least one CoD:
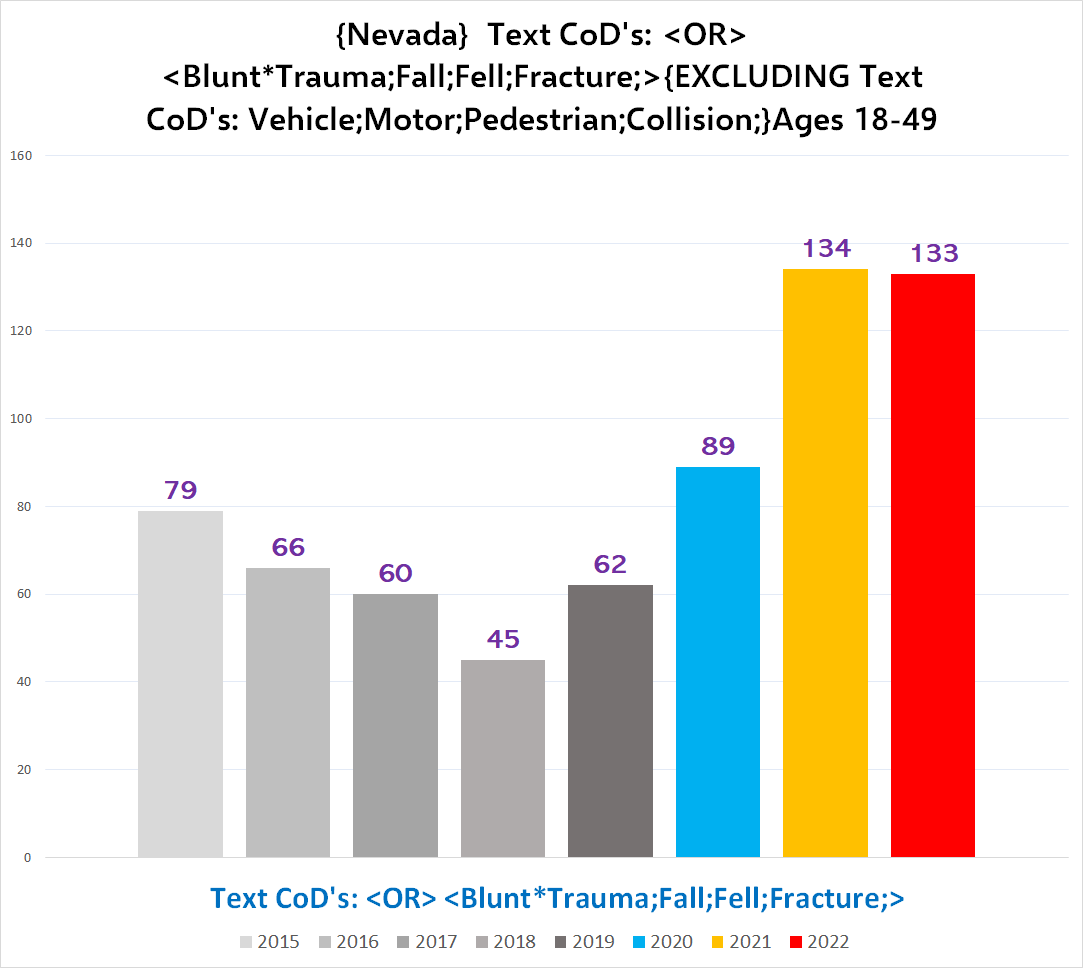
Age
Specifically, Ages 18-49:
This gets weirder though.
Here’s the Ages 18-49 cohort by month:
WHAT ON EARTH HAPPENED IN SEPTEMBER 2021?????
The deviation in September is so monstrous that it seems like a caricature, or maybe a mad-libs insertion, but not actual data.
How can the answer to “what is the next number in this sequence: 6,4,6,6,6,5,_?” be. . . *29*?!?
And let’s not forget the other massive outliers in September and October of 2022.
***********
Ultimately, there is clearly substantial excess mortality in Nevada involving physical accidents that begins in 2021.
The bizarre, cartoonish explosion of such deaths in September 2021 among 18-49 year old’s, and to a lesser extent in Sep/Oct 2022, defy any sort of conventional epidemiological wisdom. That’s what you’d expect if there was a terrorist attack. It certainly was not covid, that’s for sure.
Of course, our austere public health officials cannot be bothered to address actual public health concerns.
But those who with eyes to see, ears to hear, and a brain to reason can put two and two together.















Amazing work! Sad... but extremely convincing data.
Incredible work and so valuable to piece together what happened the past few years, thank you!