Minnesota's cataclysmic cardiac catastrophe, Part 1: Hypertensive Heart Disease
Why are cardiac and circulatory deaths still going UP... in 2023????
Note: This article is written using toned-down prose in order to be able to appeal to people who would be hostile to strident or blunt language.
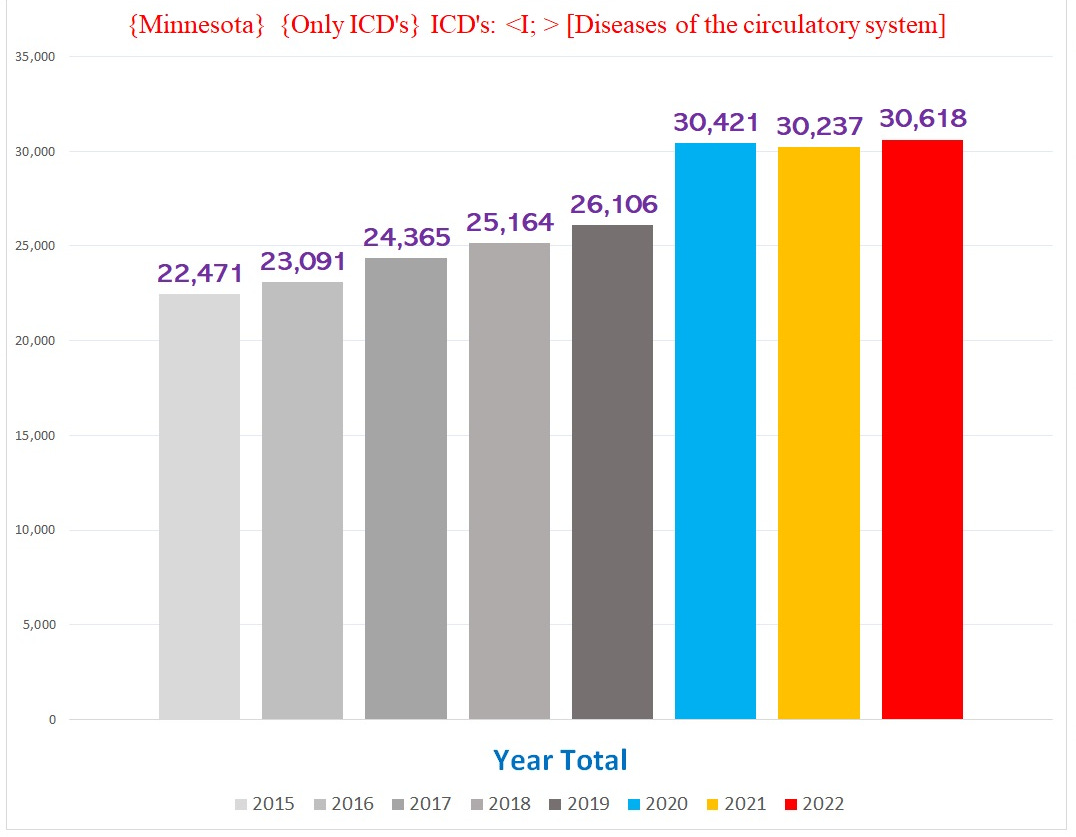
As you can see depicted in the above two charts, there is a crisis of ongoing excess death involving conditions of the heart and circulatory system (from hereon “COTHACS”), represented by the “I” codes of the ICD-10 diagnostic code database.
There are at least *78* unique ICD codes where the topline numbers are above normal in Minnesota during 2021-2023 (list in footnote1).
This is astounding. One would think that in a sane world, this would be, at bare minimum, the subject of a massive and thorough investigation. Alas, we don’t live in a sane world. The thousands of excess COTHACS deaths are widely ignored, even as a pandemic of “sudden deaths” continues afforce and every day new victims swell the ranks struck down by ‘unclear’ causes.
Because there are so many ICD “I” codes in excess territory, we will have to present them individually.
This article will focus on ICD code I11: Hypertensive Heart Disease. I chose to begin with I11 because it has the most dramatic excess out of all the COTHACS conditions.
ICD Code I11: Hypertensive Heart Disease (HHD)
(Note: make sure to read the chart titles, they describe precisely what data the chart is depicting)
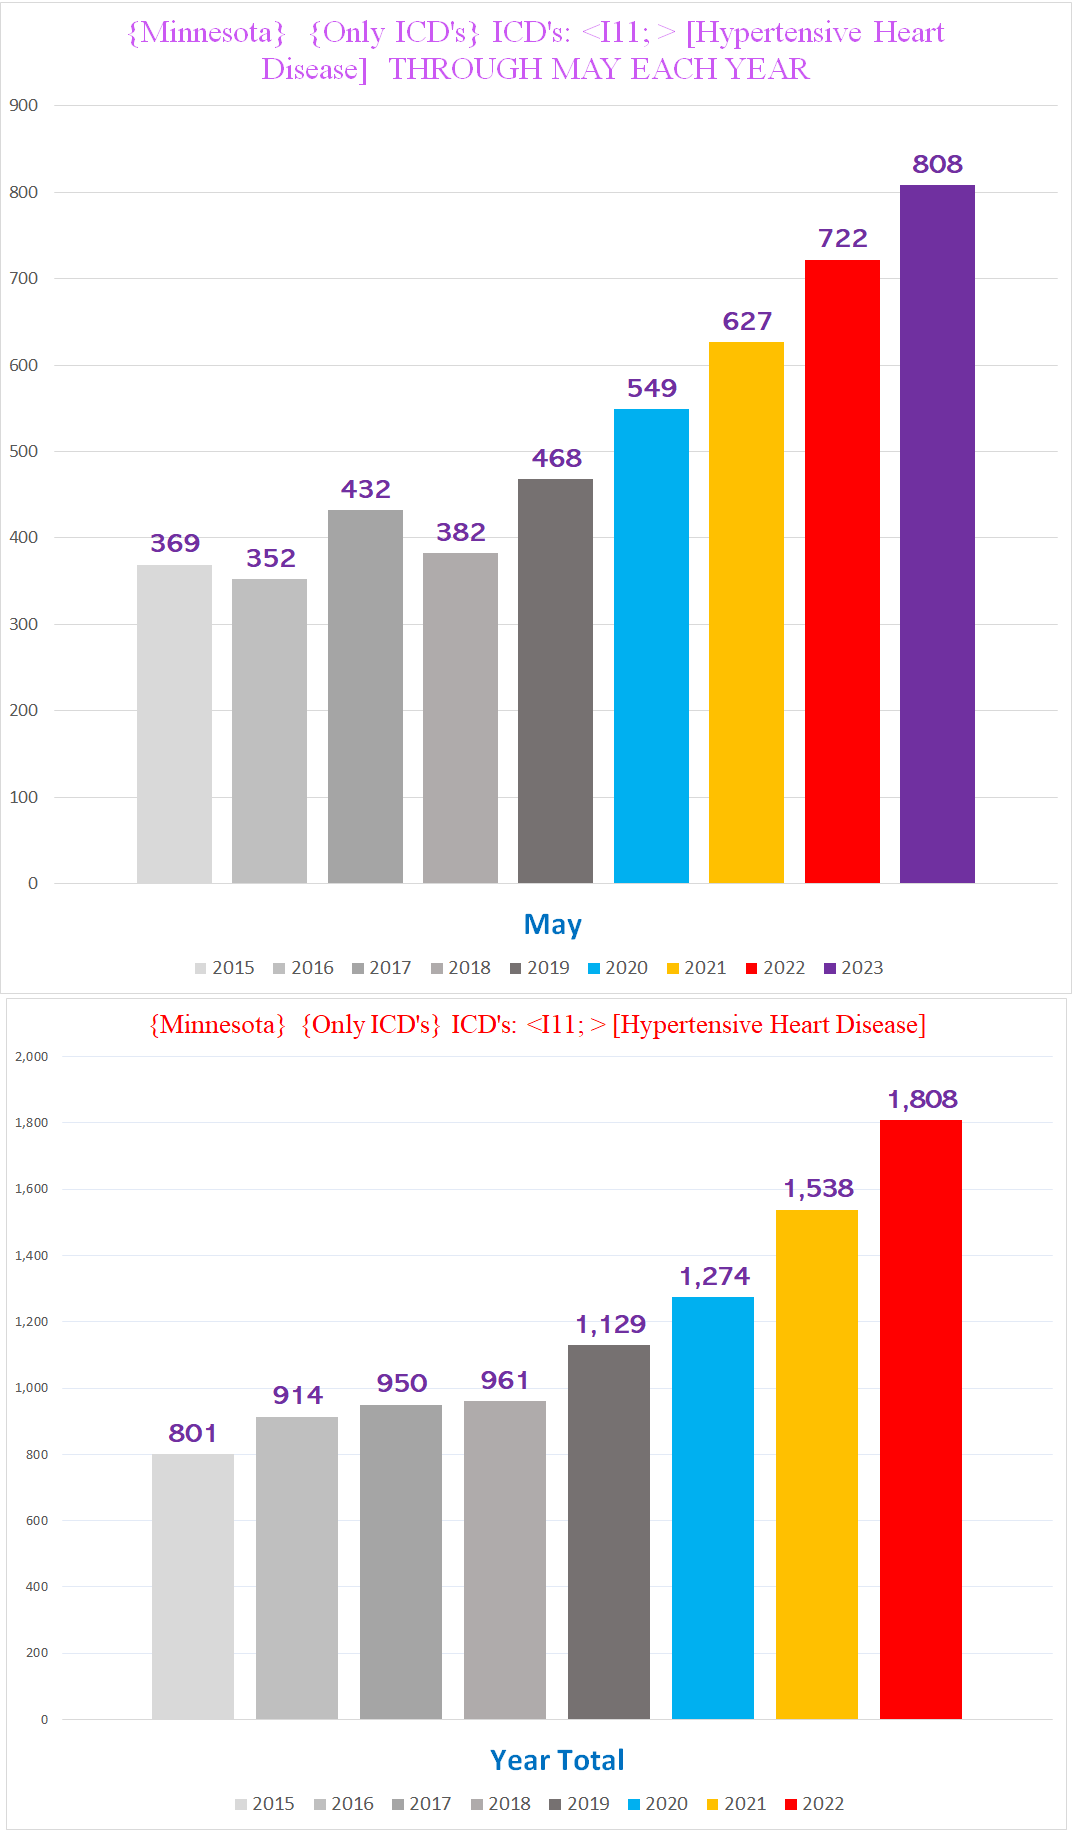
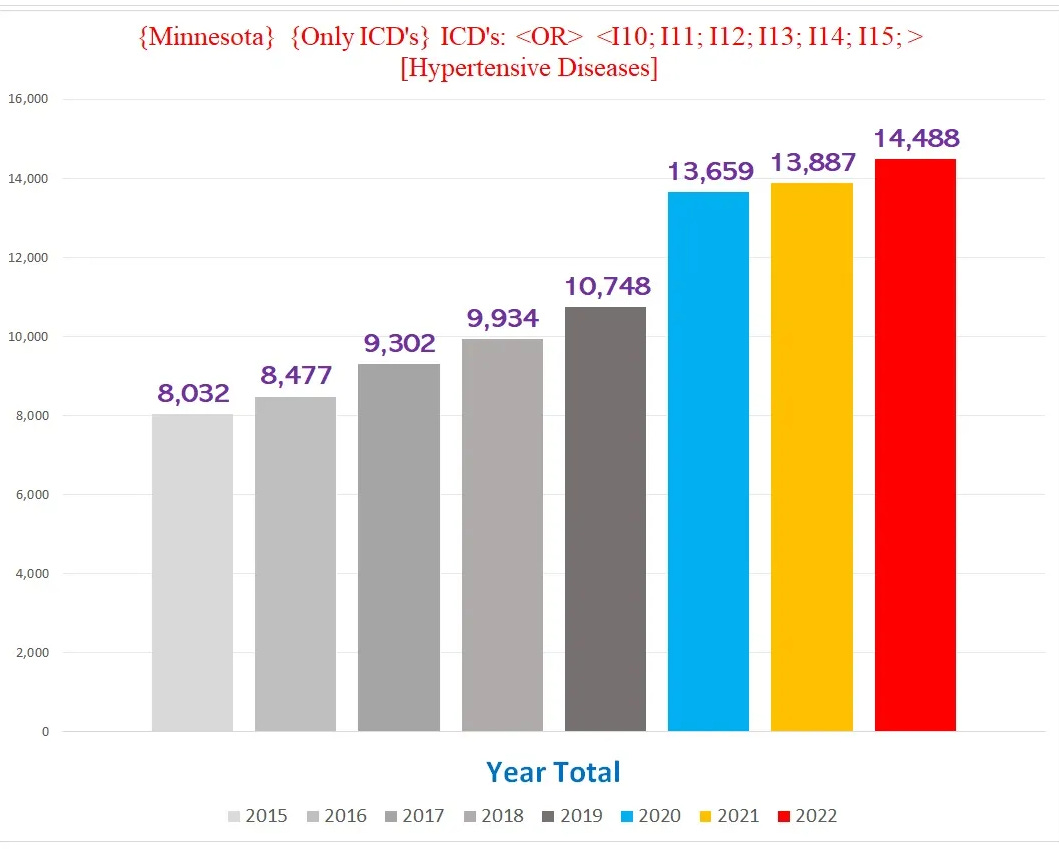
The following two charts show the total number of deaths involving HHD per year, through May (top), and for the entire calendar year (bottom):
Clearly there is a profound excess of something here. Surely it is unnatural for the number of deaths involving HHD to undergo a radical transformation from pretty flat year over year into the steep staircase-like increase we see in the chart above.
Interestingly, the “staircase” upward trend starts from 2019 - before the pandemic - and continues through 2023. This begs the question, does this represent one trend, or does this represent multiple, distinct trends driven by different factors? Put differently, were the increases during the pandemic years merely a continuation of a pre-pandemic trend that had nothing to do with covid or covid policies?
I submit that the answer is a very definitive *NO*. There are at least five significant differences that distinguish 2019-2020 from 2021-2022 (I am less confident in 2023 because the data from 2023 is incomplete).
#1: Age Profile:
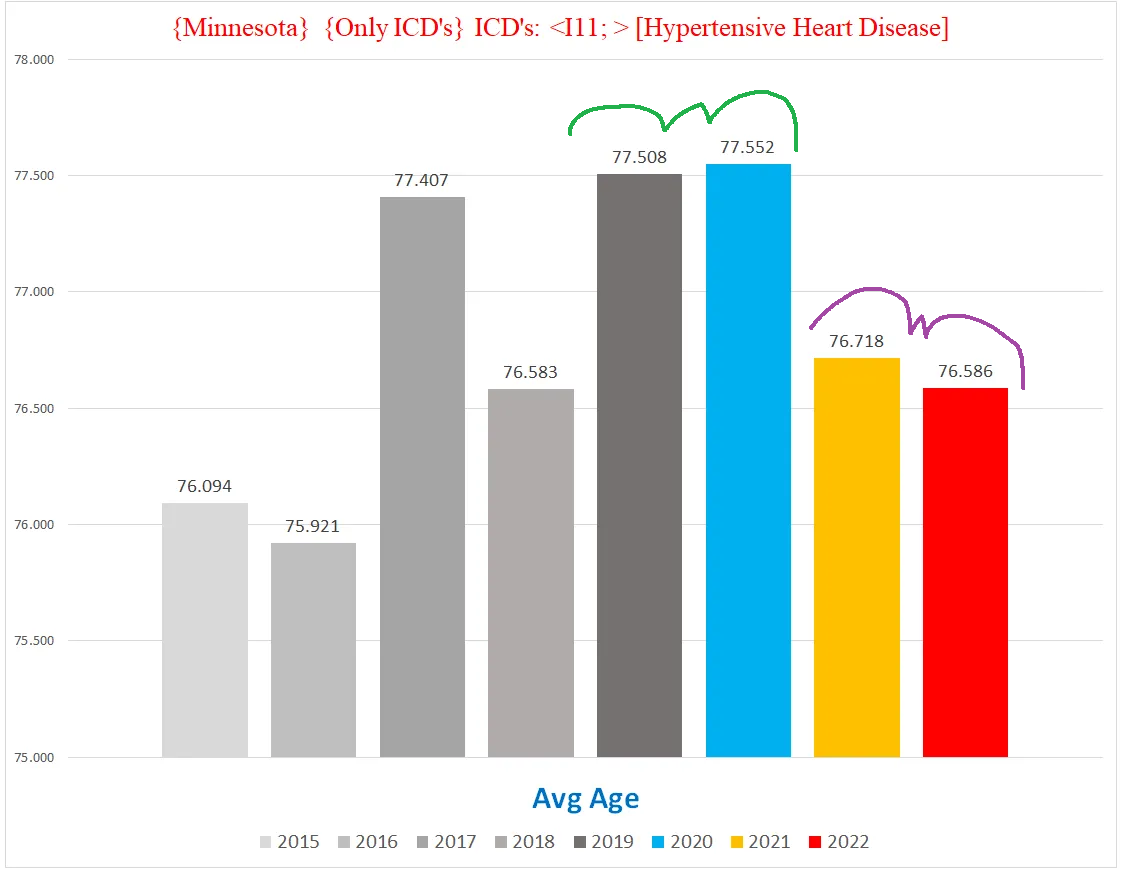
First up, average age: 2021/22 falls off a cliff from 2019/2020 by almost a full year (!!)
(The fact that the average age in 2015, 2016 and 2018 was below that of 2021/22 is irrelevant. The question we are trying to resolve is whether the excess HDD deaths of 2021/22 is a continuation of the excess trend seen in 2019/2020, not whether 2021/22 has a similar profile to years before 2019. If 2021/22 were a continuation of the 2019/20 trend, it should have a similar profile to 2019/20 especially for the characteristics where 2019/20 depart from prior years.)
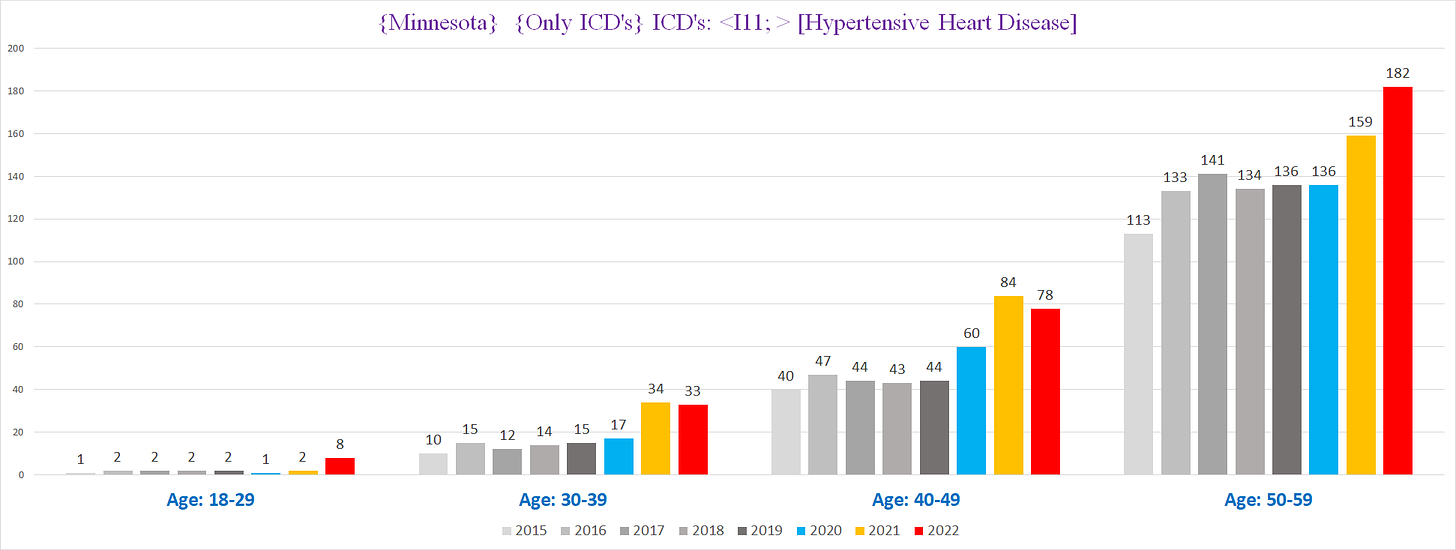
When we look at the profile of the younger age cohorts, this difference is even more stark - every age bracket sees indisputably clear excess HHD deaths, including FOUR times the expected rate of two per year in the 18-29 cohort:
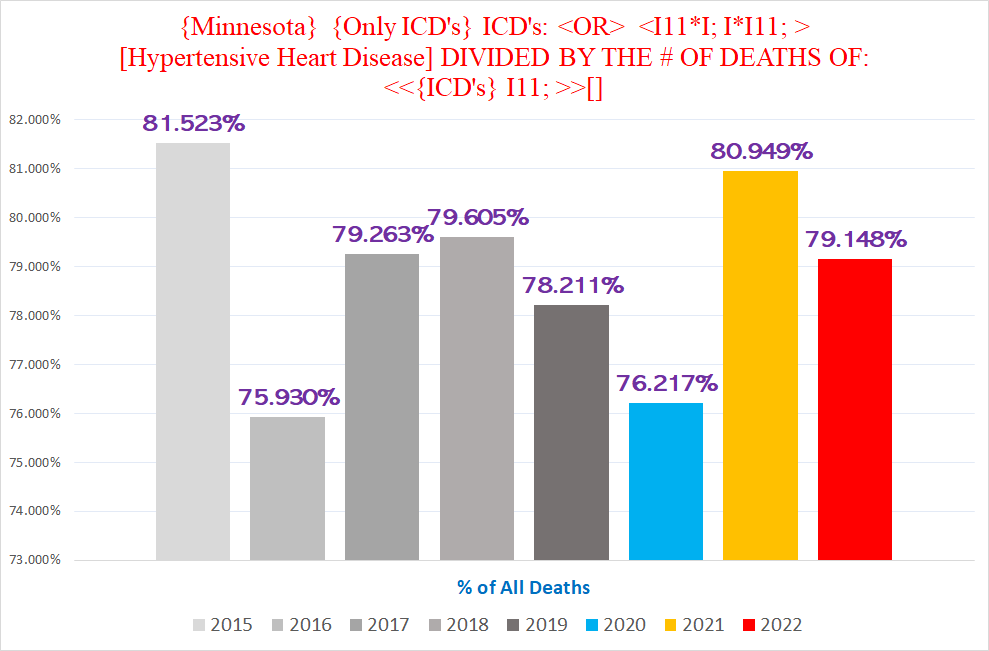
#2: % of all deaths that are HHD:
Again we see 2019/2020 are pretty close to each other, but 2021/22 are markedly different - in this case, the % of deaths with HHD goes shooting up in 2021 and then again in 2022 over 2021, both adding about 17% over 2020:
#3: % of HDD deaths where HDD is the UCoD (Underlying CoD):
Again we see a clear difference between 2019/20 & 2021/2022, albeit this time the % goes down:
(To be fair, I don’t think this particular datapoint is all that compelling in itself. UCoD designation is something that is fraught with multiple uncertainties stemming from how coroners and the CDC document and code the various conditions identified as CoD’s. However, even as an administrative phenomenon, the drop in UCoD % in 2021/22 compared to 2019/20 might nevertheless represent a distinct clinical reality coroners and/or the CDC are reacting/adjusting to in the broader context of the other differences between 2019/20 vs 2021/22.)
#4: % of HHD deaths that have MULTIPLE “I” codes:
A higher % of HHD deaths in 2021/2022 have another “I” code on the death certificate - in other words, multiple COTHACS conditions were documented as CoD’s on the death certificate. Moreover, 2021 broke a three year trend where this % was going DOWN year over year, suggesting the introduction of a novel factor in HHD deaths:
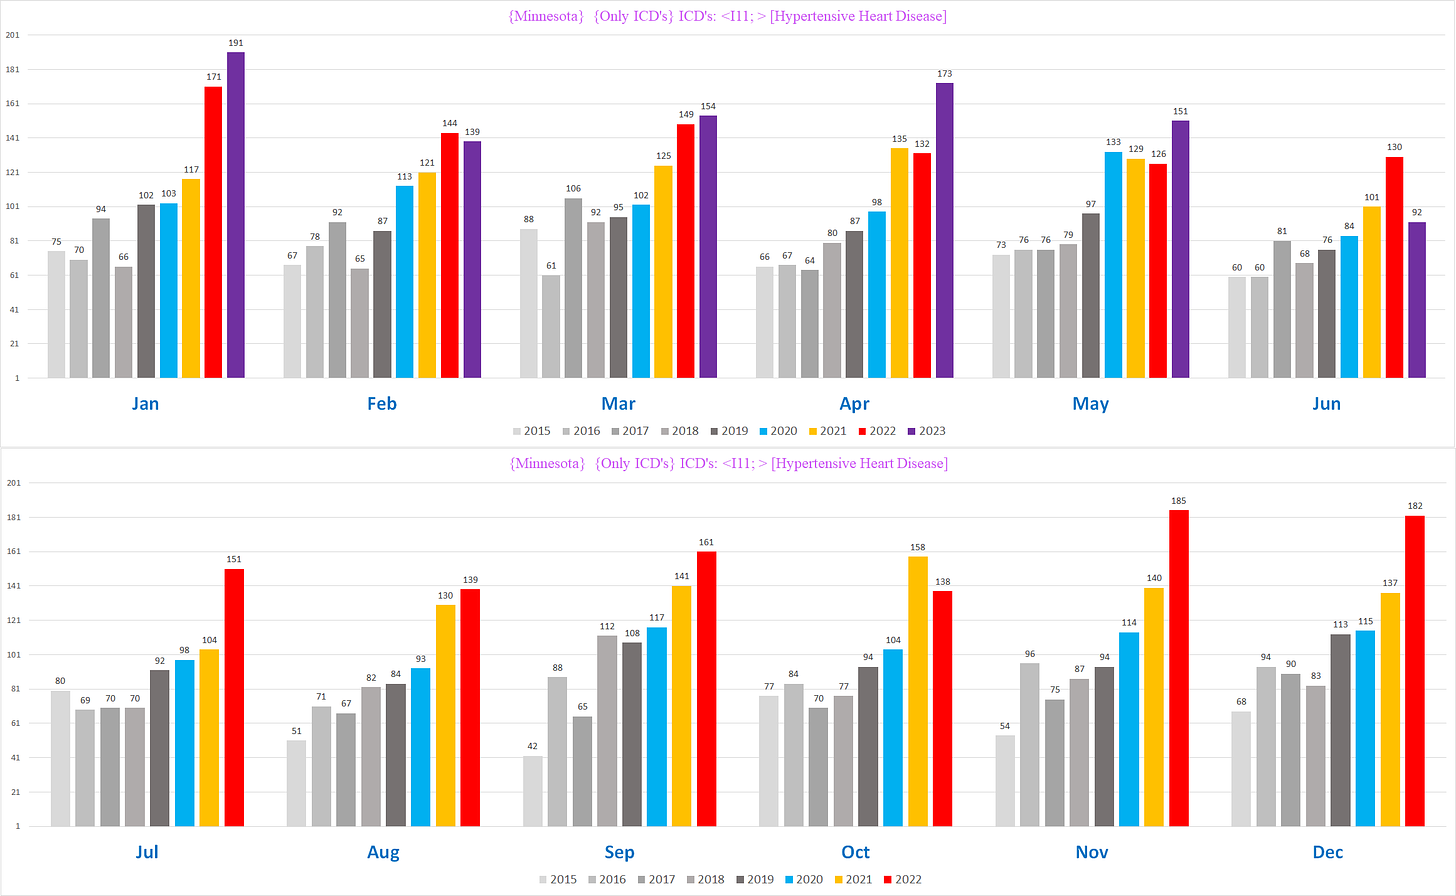
#5: Timing of the deaths throughout the year:
Comparing monthly HHD mortality, 2021 or 2022 clearly break apart from 2019/2020 or any conceivable trend running through 2020 in January, March, April, June, July, August, September, October, and December:
An ominous trend we can also see is that 2023 is soundly eclipsing even 2022 so far.
(*Note: June 2023 is incomplete)
If we map this out linearly by quarter year, the ‘extra’ excesses of 2021+ compared to 2019/2020 are pretty stark:
The totality of these differences between 2019/2020 and 2021/2022 suggests that they represent distinct phenomena rather than a continuous single factor driving a steady increase year over year.
What drove the excess HHD deaths in 2019/2020 that wasn’t responsible for 2021+?
I suspect that the basic explanation of the difference between 2019/2020 vs 2021+ is that the excess deaths in 2019/2020 were the result of an ‘administrative phenomenon’ that resulted in either more HHD’s getting picked up, either because coroners were more attentive or informed of the presence of HHD, or because more variations of text descriptions were coded as HHD by the CDC’s algorithm.
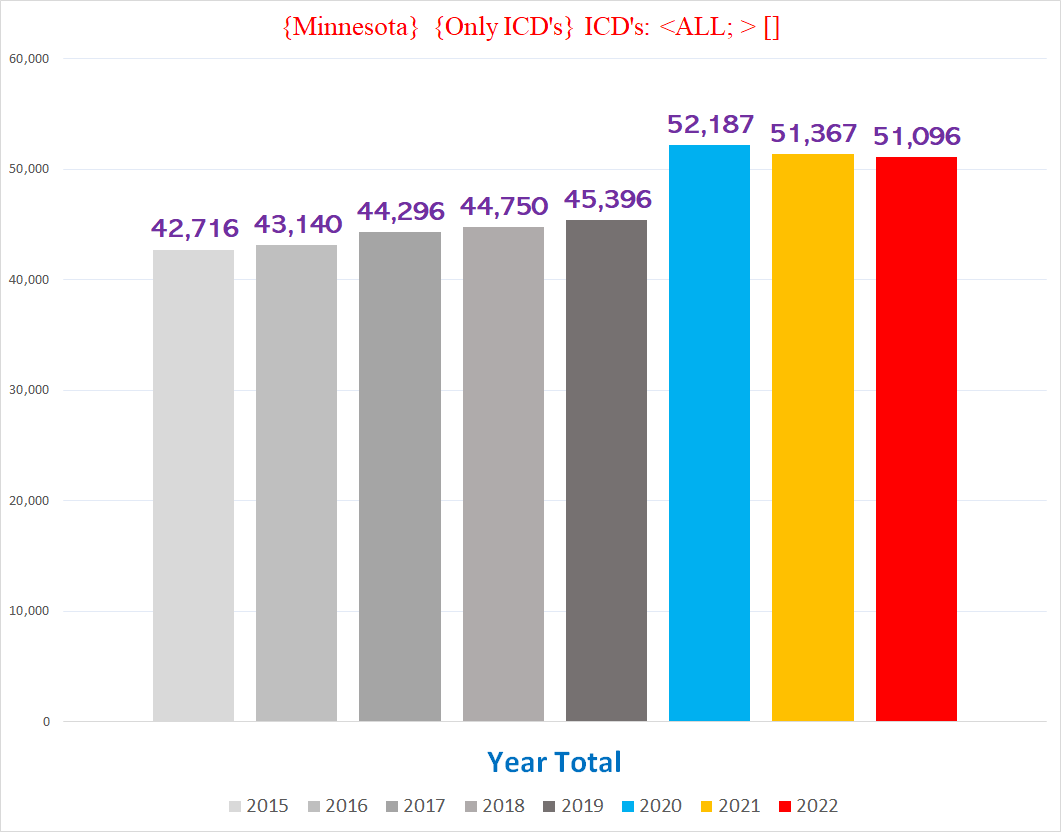
This would explain why the % of all deaths that were HHD’s is roughly the same in 2019 as 2020, despite 2020 having significant excess mortality overall whereas 2019 had NO discernable overall excess whatsoever:
In other words, if coroners simply caught a higher % of HHD’s or the CDC coded a higher % of routine deaths as HHD, the excess in 2020 is simply reflecting the % of older people killed by covid or covid policies that happened to also have HHD. Hypertension is a very common condition in society, and is likewise fairly prevalent in people dying:
When >2% of decedents have HHD, any excess death from non-accidental causes would be expected to have a % in that ballpark with HHD. If in 2019 there was better surveillance of HHD or more aggressive adjudication by the CDC of text descriptions to HHD, that would create an artifact of ‘excess’ HHD deaths despite no increase in deaths overall. And because the average age of death in 2020 was functionally identical to the average age of death in 2019, we find roughly the same percentage who died ‘with’ HHD in 2020 as in 2019.
The upshot of this is that the excess HHD’s of 2019/2020 were very possibly just a reflection of better surveillance of decedents’ medical conditions:
Pull-Forward Effect
We would be remiss to not mention another major factor that is highly relevant here: the so-called “pull-forward effect”. In laymen’s terms, this refers to a situation where people die ‘early’, before they were supposed to. In our case, a bunch of people who would’ve died in 2021 or 2022 were killed in 2020. This should lead to a deficit in deaths *below* the expected baseline in 2021 and beyond, because some of the deaths that were slated to occur in 2021, 2022 or 2023 died in 2020, where lots of extra older people died who were going to die soon anyways. Then 2021 also saw excess deaths pulling even more away from 2022, 2023 etc., and so on.
This means that a ‘staircase’ trend is unlikely to represent a stable trend of steady-state increase year over year that is “baked in to the cake”, because the bottom should fall out in 2021 and beyond. In other words, if the natural trend was a ‘staircase’, it should manifest more like the top of an escalator, flattening out as the natural increase in these years cancels out against the mortality deficit created by the pull-forward effect from the excess deaths of prior pandemic years.
🔷🔷🔷🔷🔷🔷🔷🔷
It is indisputable that the data derived from CoD’s documented on Minnesota death certificates show a massive increase in the number of people dying with HHD in 2021, 2022 and 2023 to date that is presumptively attributable to a novel factor not present before 2021.
It is critical to emphasize that the covid vaccines must be considered as a plausible cause of the excess HHD incidence seen in these mortality data. It is now firmly established as a scientific matter that these vaccines can instigate pathogeneses that affect the heart and circulatory system. One cannot help but wonder if it is precisely because of the possible or likely role of the covid vaccines in the currently ongoing excess mortality that public health authorities and governments at large steadfastly refuse to acknowledge the reality of the excess mortality altogether.
Regardless of what this ‘mystery’ something driving the excess HHD deaths is, the almost doubling of the number of such deaths in the span of a mere two years amounts to a public health emergency that must be properly and thoroughly addressed with all due haste.
ICD Code I05 Chronic Rheumatic Heart Diseases
ICD Code I050 Mitral valve stenosis
ICD Code I07 Rheumatic tricuspid valve diseases
ICD Code I08 MALE Multiple valve diseases
ICD Code I10 Essential (primary) hypertension
ICD Code I11 Hypertensive Heart Disease
ICD Code I110 Hypertensive heart disease with (congestive) heart failure
ICD Code I119 Hypertensive heart disease without (congestive) heart failure
ICD Code I12 Hypertensive renal disease
ICD Code I130 Hypertensive heart and renal disease with (congestive) heart failure
ICD Code I131 Hypertensive heart and renal disease with renal failure
ICD Code I132 Hypertensive heart and renal disease with both (congestive) heart failure and renal failure
ICD Code I20 Unstable angina
ICD Code I21 MALE Acute myocardial infarction
ICD Code I214 Acute subendocardial myocardial infarction
ICD Code I24 Acute subendocardial myocardial infarction (MALE)
ICD Code I25 Chronic ischemic heart disease
ICD Code I250 Atherosclerotic cardiovascular disease, so described
ICD Code I251 Atherosclerotic heart disease
ICD Code I255 ischemic cardiomyopathy
ICD Code I26 Pulmonary embolism
ICD Code I27 Other pulmonary heart diseases
ICD Code I313 Pericardial effusion (noninflammatory)
ICD Code I34 Nonrheumatic mitral valve disorders (MALE)
ICD Code I340 Mitral (valve) insufficiency
ICD Code I35 Nonrheumatic aortic valve disorders
ICD Code I38 Endocarditis, valve unspecified
ICD Code I420 Dilated Cardiomyopathy
ICD Code I421 Obstructive hypertrophic cardiomyopathy
ICD Code I422 Other hypertrophic cardiomyopathy
ICD Code I429 Cardiomyopathy, unspecified
ICD Code I440 Atrioventricular block, first degree
ICD Code I442 Atrioventricular block, complete
ICD Code I443 Other and unspecified atrioventricular block
ICD Code I447 Left bundle-branch block, unspecified
ICD Code I45 Other conduction disorders
ICD Code I46 Cardiac Arrest
ICD Code I47 Paroxysmal tachycardia
ICD Code I48 Atrial fibrillation and flutter
ICD Code I49 Other cardiac arrhythmias
ICD Code I500 Congestive heart failure
ICD Code I501 Left ventricular failure
ICD Code I509 Heart failure, unspecified
ICD Code I51 Complications and ill-defined descriptions of heart disease
ICD Code I62 Other and unspecified nontraumatic intracranial hemorrhage
ICD Code I630 Cerebral infarction due to thrombosis of precerebral arteries
ICD Code I631 Cerebral infarction due to embolism of precerebral arteries
ICD Code I632 Cerebral infarction due to unspecified occlusion or stenosis of precerebral arteries
ICD Code I635 Cerebral infarction due to unspecified occlusion or stenosis of cerebral arteries
ICD Code I639 Cerebral infarction, unspecified
ICD Code I670 Dissection of cerebral arteries, nonruptured
ICD Code I679 Cerebrovascular disease, unspecified
ICD Code I692 Sequelae of other nontraumatic intracranial hemorrhage
ICD Code I693 Sequelae of cerebral infarction
ICD Code I694 Sequelae of stroke, not specified as hemorrhage or infarction
ICD Code I698 Sequelae of other cerebrovascular diseases
ICD Code I700 Atherosclerosis of aorta
ICD Code I701 MALE Atherosclerosis of renal artery
ICD Code I71 MALE Aortic aneurysm and dissection
ICD Code I710 Dissection of aorta
ICD Code I712 Thoracic aortic aneurysm, without rupture
ICD Code I714 MALE Abdominal aortic aneurysm, without rupture
ICD Code I719 Aortic aneurysm of unspecified site, without rupture
ICD Code I72 Other aneurysms
ICD Code I73 Other peripheral vascular diseases
ICD Code I745 Embolism and thrombosis of iliac artery
ICD Code I77 Other disorders of arteries and arterioles
ICD Code I80 Phlebitis and thrombophlebitis
ICD Code I82 Other venous embolism and thrombosis
ICD Code I822 Embolism and thrombosis of vena cava and other thoracic veins
ICD Code I85 Esophageal varices with bleeding
ICD Code I86 Varicose veins of other sites
ICD Code I87 Other disorders of veins
ICD Code I872 Venous insufficiency (chronic) (peripheral)
ICD Code I890 Lymphedema
ICD Code I95 Hypotension
ICD Code I97 Intraoperative and postprocedural complications and disorders of circulatory system, not elsewhere classified
ICD Code I99 Other and unspecified disorders of circulatory system







Look over there! It's ALIENS!
From outer spaaaaace!
Answer: Fauci's poison death shot, which Democratic politicians in Minnesota peddled, promoted, and mandated.