


Did the CDC Doctor Their 2021 Study That (Still) Showed Vaccinated People Were as Infectious as Unvaccinated People?
CDC: 'Centers for Data Concealment'

It is now widely acknowledged that the covid vaccines do not prevent infection or transmission. Undeterred by the lack of any legitimate data or evidence indicating that the covid vaccines reduced infections or transmission by those infected, the establishment nonetheless went ahead and declared in no uncertain terms from the get-go that it was 100% obvious that it was 100% certain that the vaccines were 100% effective at stopping 100% of infections and 100% of transmission of covid.
As it turned out, the CDC had conducted a study that finished before September 2021, showing that the vaccines did not in fact reduce covid infections or transmission.


To put this in perspective, the study was completed shortly before the Biden administration decided to announce vaccine mandates for the majority of the nation. The “unlikely” confluence of these two events during the summer of 2021 suggests that this study may well have been conducted specifically in order to provide much-needed justification and evidence for the pre-planned vaccine mandates already in development at that time.
It is certainly plausible that a nakedly partisan and political activist CDC would be willing to corruptly manipulate the study’s data or results if they would undermine the narrative of the Biden administration and medical community establishment - the likely raison dêtre of the study.
With that in mind, there is a significant discrepancy in certain critical data presented in different locations within this study. Considering the context and the actors, it is absolutely legitimate to raise the question of possible malfeasance or fraud.
Unusual Publishing Choices by the CDC?
This is definitely a CDC study - 19 of the 29 listed authors on this study are affiliated with the CDC (underlined in red):

The study was first posted on the MedRxiv preprint server November 19, 2021 - after the enacted vaccine mandates were firmly entrenched into the political & legal etiquette of society, and were therefore safe from being undermined by new studies.

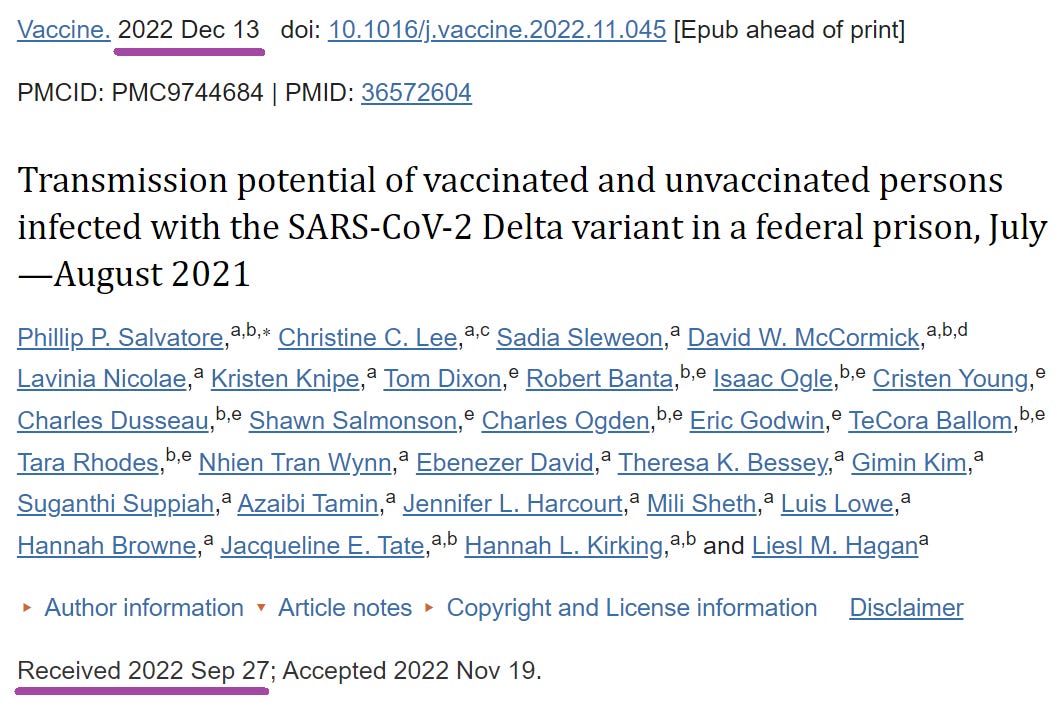
Yet the CDC delayed submitting the study to a journal. . . until September 27, 2022 - almost a full year later. It was only first published online as a peer-reviewed paper in Elsevier December 13, 2022:
Transmission potential of vaccinated and unvaccinated persons infected with the SARS-CoV-2 Delta variant in a federal prison, July-August 2021
https://pubmed.ncbi.nlm.nih.gov/36572604/
Curiously, the journal this study was submitted to is Vaccine, “the official journal of The Japanese Society for Vaccinology”:
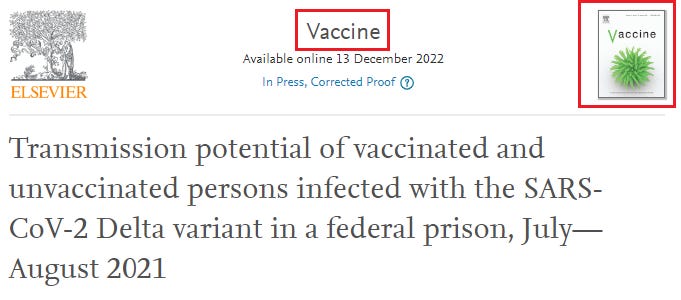
Nothing against the Japanese Society for Vaccinology, or Japan in general, but is it normal for the CDC to publish what should have been a seminal study directly relevant to the most prominent, urgent and impactful public health situation in a century in a low-impact journal nobody ever heard of halfway across the world? (This question feels more rhetorical than practical.)
To summarize, the manner and actions of the CDC while conducting and publishing this study strongly suggest that this was first and foremost a political endeavor, not a scientific one.
Simple Overview of the Primary Study Results
In order to grasp the potential discrepancy that this article aims to highlight, we need to have a basic idea of what the researchers did in the study & what they observed.
Firstly, it is worth emphasizing that the results of this study were so profoundly disastrous to the official narrative that even after spinning and manipulating the findings, the authors were still compelled to write the following statement in the conclusion:
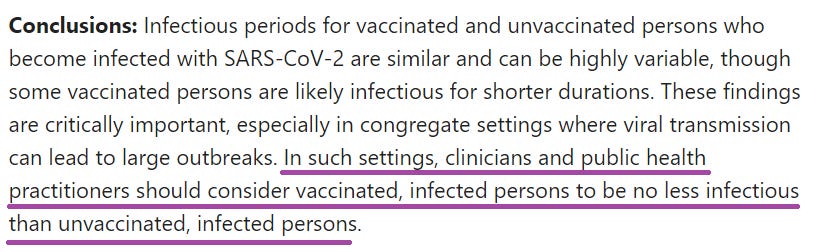
“clinicians and public health practitioners should consider vaccinated, infected persons to be no less infectious than unvaccinated, infected persons.”
If nothing else, this offers a glimpse at the political impact of the CDC’s decision to delay publicizing the study when the results were first available. If such a statement - made by CDC scientists, in an official government study - would have entered the public discourse before or while the mandates were announced, things might have gone a bit differently.
What specifically did the study find?
There were two major critical findings in this study - findings that the authors tried to spin and disguise (Two critical charts from the main study text in footnote1).
Firstly, the infectious period was essentially the same for vaccinated & unvaccinated people. (Infectious period = the time span where someone infected with covid was contagious (i.e. the virus was still alive and replicating in the sick person.))
Secondly - and far more significantly - the study observed that infected vaccinated people carried much higher viral loads on average than similarly infected unvaccinated people during the time period where they were infectious.
What did the study measure/test to observe these characteristics?
Since the study made copious use of PCR tests, we will give a brief explanation of the relevant PCR details:
Primer on PCR Tests (nerdy pun intended)
(Note: PCR tests are not quite as perfect in the real world where there are other things that can influence/interfere with a PCR test. The following description is only intended to convey the basic structure, which is sufficient for our purposes.)
Simply illustrated, let’s say that the PCR machine needs to see 100 pieces of covid RNA in a sample to register a positive result. The “test” part of a PCR test is run a bunch of times - “cycles” - until it either returns a positive result (found 100 pieces of covid RNA), or reaches a preset maximum number without getting a positive result & is considered to be negative. Each additional cycle doubles the amount of RNA in the sample until there are enough RNA pieces to detect a positive result (very oversimplified). The more virus RNA a sample starts with, the fewer cycles are necessary to amplify the number of RNA pieces to reach the threshold where the machine detects them & registers a positive result.
Thus, someone who tests positive at 24 cycles had twice as much detectable viral RNA as someone who tests positive at 25 cycles.
PCR positives higher than 35 cycles were presumed to be just picking up bits of RNA from dead bits of viral particles - if there was live virus, there should be enough RNA in a sample to be detected by then.
Back to the study:
The researchers took samples for 10 consecutive days from prisoners who were presumed to have covid because they had covid symptoms during a covid outbreak within the prison population. These samples were tested for the presence of covid virus RNA using a PCR test. Samples that were positive on PCR at 35 cycles or lower (CT) were also cultured** afterwards to see if the positive PCR test was picking up live virus that could replicate and was thus contagious, or if the positive PCR result was just picking up bits of bits of RNA from dead virus particles.
(**Culturing a virus is a way of testing a sample to see if there is actual live virus there (in laymen’s terms, it means they tried to ‘grow’ the virus in cells on a petri dish). This is a useful way of weeding out some positive PCR results that are just picking up virus RNA from dead bits of viral debris.)
The takeaway from this is that in order to be considered positive for live covid virus, both of the following conditions had to be met:
Positive PCR test at 35 cycles or lower
Positive viral culture
Study Results
Since the goal of this article is to highlight the possibility of fraudulent manipulation of the data, we will not disregard the (lengthy) discussion and presentation of the results in the study’s main text.
We’ll start with Figures #3A & #3B, the critical charts from the supplementary materials. (Data harmful or inconsistent with the official narrative or other political considerations are often dumped in the supplementary material appendices, where only the most intrepid data nerds ever venture.)
The charts show the results for the individual samples that tested positive on PCR at or below 40 Cycles - in other words, what *should* be all of the PCR-positive samples.
Positive PCR tests at a CT above 35 were presumed to be negative for live virus, and are marked with a empty circle.
Positive PCR tests at a CT at or below 35 that were cultured but the culture was negative are marked with an ‘X’.
Positive PCR tests that had a positive culture result are marked by a filled-in circle.
As stated earlier, the lower the cycle # of a positive result, the more virus there is. Every 1 CT lower = TWICE the amount of detectable viral RNA in the sample.
The green lines I added indicates 20 CT’s - anything below is a positive at less than 20 cycles, anything above was more than 20 cycles (& on the line = 20 cycles)
Figure #3A - Vaccinated:
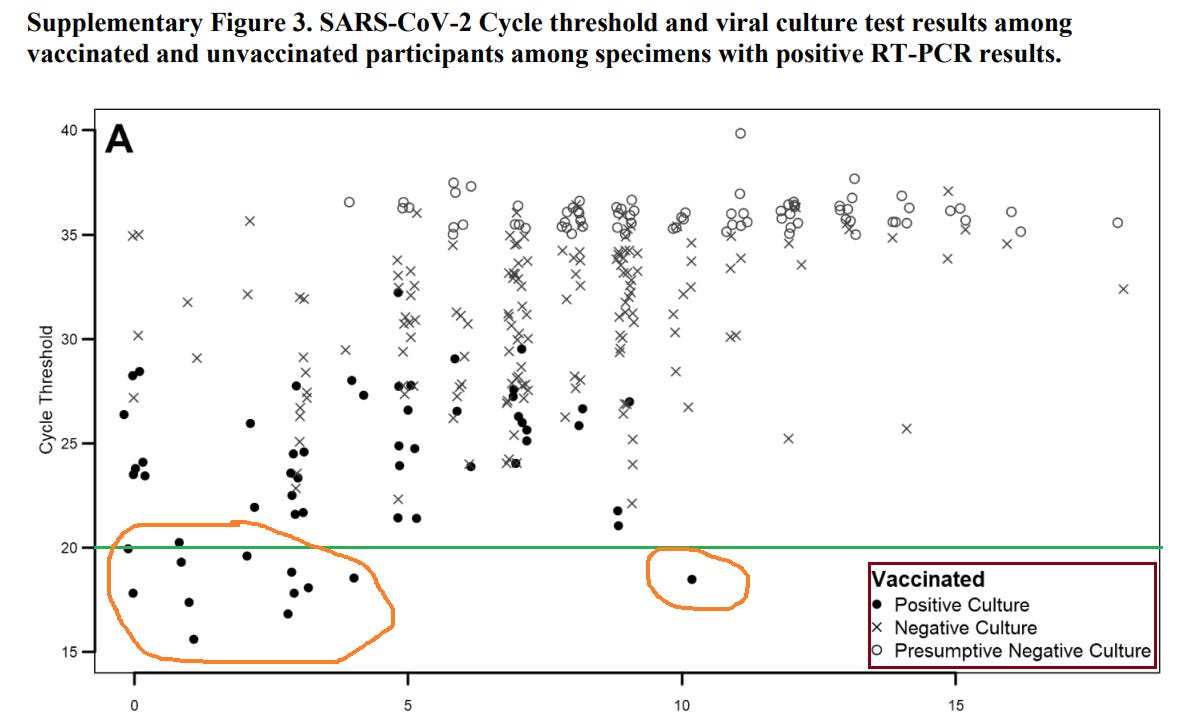
Figure #3B - Unvaccinated:
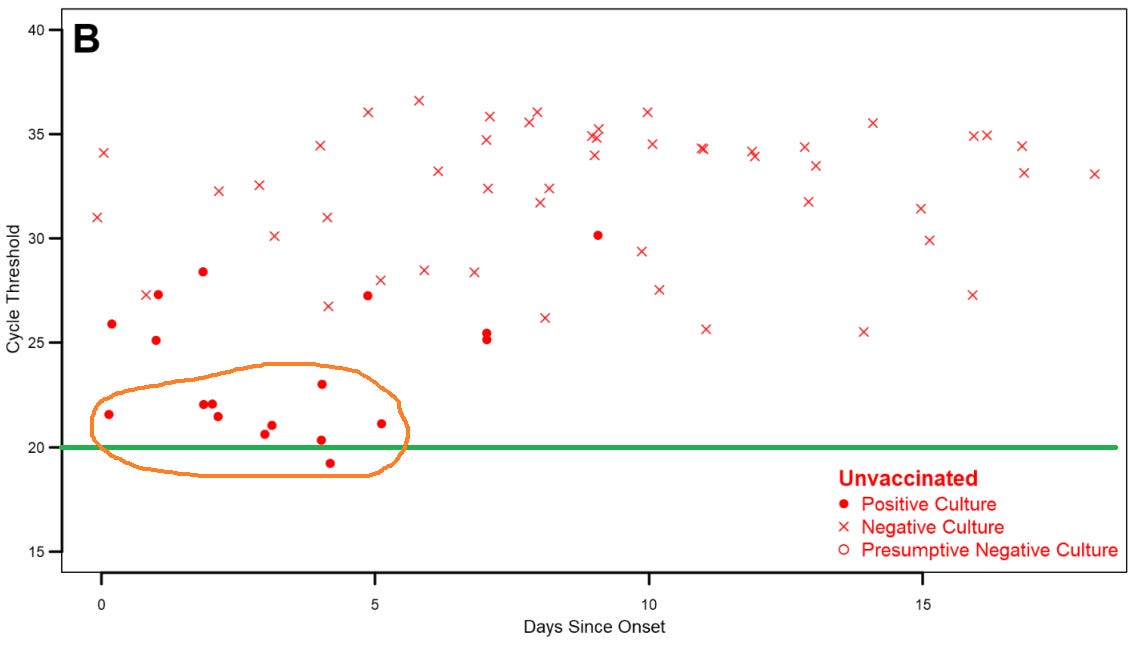
Right off the bat, if you compare at the highest observed viral loads of the vaccinated prisoners vs the highest observed viral loads of the unvaccinated prisoners, the highest viral loads in the vaccinated people are between 2x-16x as large as the highest viral loads in the unvaccinated people. This is a huge difference.
If you have higher viral loads of live virus, you shed more live virus when you breathe, cough, etc. Ergo, the vaccinated people had much more potential - orders of magnitude higher - than the unvaccinated to transmit covid to others.
The Potential Fraud:
Did the CDC Scientists Omit Some of the PCR-Positive Samples of Vaccinated Prisoners with [Even Lower] Extremely Low Cycle #’s?
**Or put differently, did the CDC scientists omit samples with possibly more than 100x the peak viral load found in unvaccinated prisoners??**
Figure #1 from the study text (below) shows all the characteristics for every sample that was taken from each participant in the study - EXCEPT for the specific Cycle # of positive PCR tests.
The legend for this chart is as follows:
filled-in circles = negative PCR
empty circles = positive PCR
empty circles shaded yellow = PCR positives >35 CT’s
empty circles shaded blue = positive PCR <35 CT’s that were also POSITIVE cultures
empty circles shaded pink = positive PCR <35 CT’s that were NEGATIVE cultures
empty circles unshaded = positive PCR <35 CT’s without a documented culture (This is the critical category)
Every PCR-positive sample from the unvaccinated group was cultured except for the second positive sample from the last patient (bottom of unvaccinated section), taken on the 18th day after symptom onset, and whose sample from the day before tested negative in the viral culture. (There’s only 1 uncolored empty circle for all samples taken from unvaccinated prisoners.)
However, about half of the PCR-positive samples from the vaccinated prisoners were either NOT cultured or were cultured but the results were not reported by the study authors - and were NOT included in Figure #3A!! The positive cultures from vaccinated prisoners are marked by blue-shaded circles, of which there are 57. There are 57 filled-in circles in Figure #3A. So Figure #3A - the chart showing the Cycle # for the PCR positives for vaccinated prisoners - is missing all of the ‘uncultured’ positive PCR samples from the vaccinated patients, which is a substantial number of their PCR-positive samples!

Fig. 1. Timelines and results of nasal mid-turbinate specimens collected from enrolled participants, Federal prison, Texas, July 12—August 9, 2021. The timelines of specimen collection and laboratory results for 95 included participants are represented diagrammatically, indexed by the day of onset. Onset was determined to be either a) date of first onset of self-reported symptom(s) meeting the case definition of COVID-19 or b) date of first positive diagnostic SARS-CoV-2 test, whichever occurred first. Each participant is represented by a horizontal line corresponding to the investigation sampling period during their time-course of illness. Participants who were unvaccinated (including 2 participants who received only the first dose of a two-dose COVID-19 vaccine series) are depicted at the top of the figure, while vaccinated participants are depicted at the bottom. RT-PCR results are represented by solid circles (positive results) or open circles (negative results). For specimens with positive RT-PCR results for which viral culture was performed, culture results are indicated by overlaid blue boxes (positive culture results) or red boxes (negative culture results). Specimens with positive RT-PCR results with a cycle threshold (Ct) value>35 for which viral culture was not performed are indicated by overlaid orange boxes (indicated a presumptive negative viral culture result). Some participants provided specimens during case-finding testing while in quarantine and may have RT-PCR negative specimens collected prior to onset.
If you count them up, there are almost 100 empty circles in this chart representing the positive PCR tests that were not cultured & were not included in Figure #3A. Almost half of these empty uncolored circles are on the upper left of the vaccinated portion of the chart - meaning they were PCR-positive samples taken in the first few days after symptom onset where the viral load was at its highest.
--Ergo, there are probably a bunch of very low positive-PCR CT results not included in Figure #3A--
It is overwhelmingly likely that had they been included, many would have been below 20 CT’s. Does anyone really think that CDC scientists would only include the data that makes the vaccine look dreadful but leave out a large chunk of the data that would vindicate the vaccines?? The rational default presumption here is that these data were left out precisely because they would make the vaccines look even worse (!!).
If this is true, it would amount to outright fraud - you cannot simply decide to cherry-pick which results or data you will leave out of a study because it undermines your preferred result. (Well you can if you are the government or Pharma, but it’s SCIENCE, not science.)
I do not know if my speculation that this is fraud is correct - it is possible that there is a different explanation for this. It is definitely possible that I missed something. However, it is perfectly legitimate to raise the possibility of fraud or malfeasance, especially regarding people or institutions whose corruption and rich history of fraudulent activities/actions have been repeatedly proven, and have ample incentive to commit fraud here.
If my speculation is correct however, this would be solid evidence that the vaccines from the beginning were not only *not* preventing transmission, they were actively supercharging the spread of covid by jacking up the viral loads of infected vaccinated people.
Now that’s some serious efficacy.
Here are the main two charts that are supposedly showing the basic comparison between the vaccinated and unvaccinated prisoners:
Chart #1 - The % of prisoners with a positive PCR test by the # of days elapsed since day #1 of symptoms:
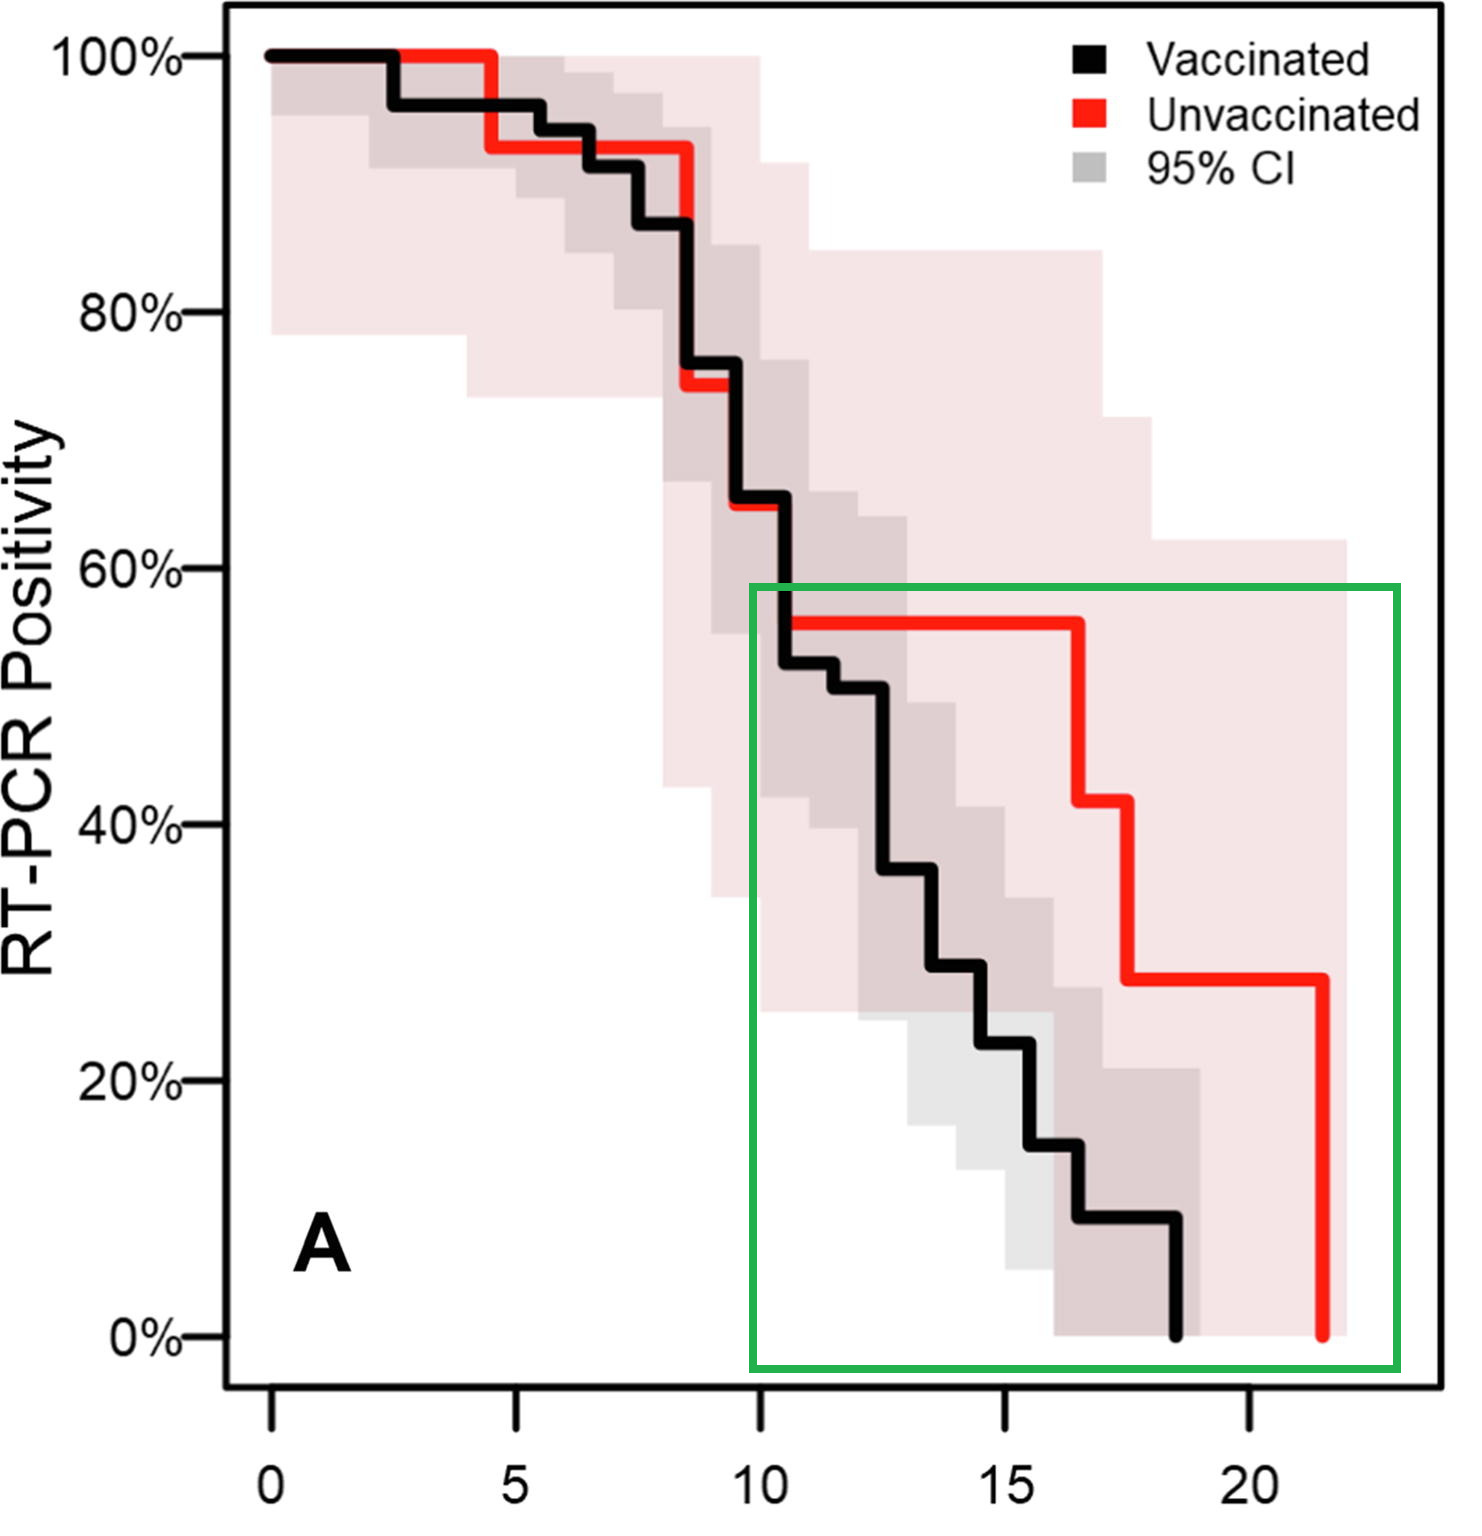
Although through the first ten days after symptom onset, the vaccinated and unvaccinated are essentially running equal, after day 10, the PCR positivity % is far lower in the vaccinated prisoners than for the unvaccinated prisoners (GREEN BOX; see footnote for a more 'enhanced' version of the chart with further explanation if this one seems confusing).
This is the most deceptive chart in the study visualizing the false establishment narrative - it offers a visually compelling but deceptive notion that the unvaccinated were “infected” for longer than the vaccinated were. As we shall see, the positive tests in the unvaccinated after 10 days were practically all negative when cultured - meaning that these positives were nothing more than bits of dead virus.
The other major chart used in the main text of the study shows the median Cycle Threshold Value (in other words, the # of cycles it took to detect viral RNA) of the PCR tests that were positive.
The following chart shows the median CT value for the positive tests. Median is the midpoint, so that half of the results were above the median, and half were below. (I drew a blue line at 30 CT’s, to denote approximately where an individual sample would usually not represent infectious virus.)
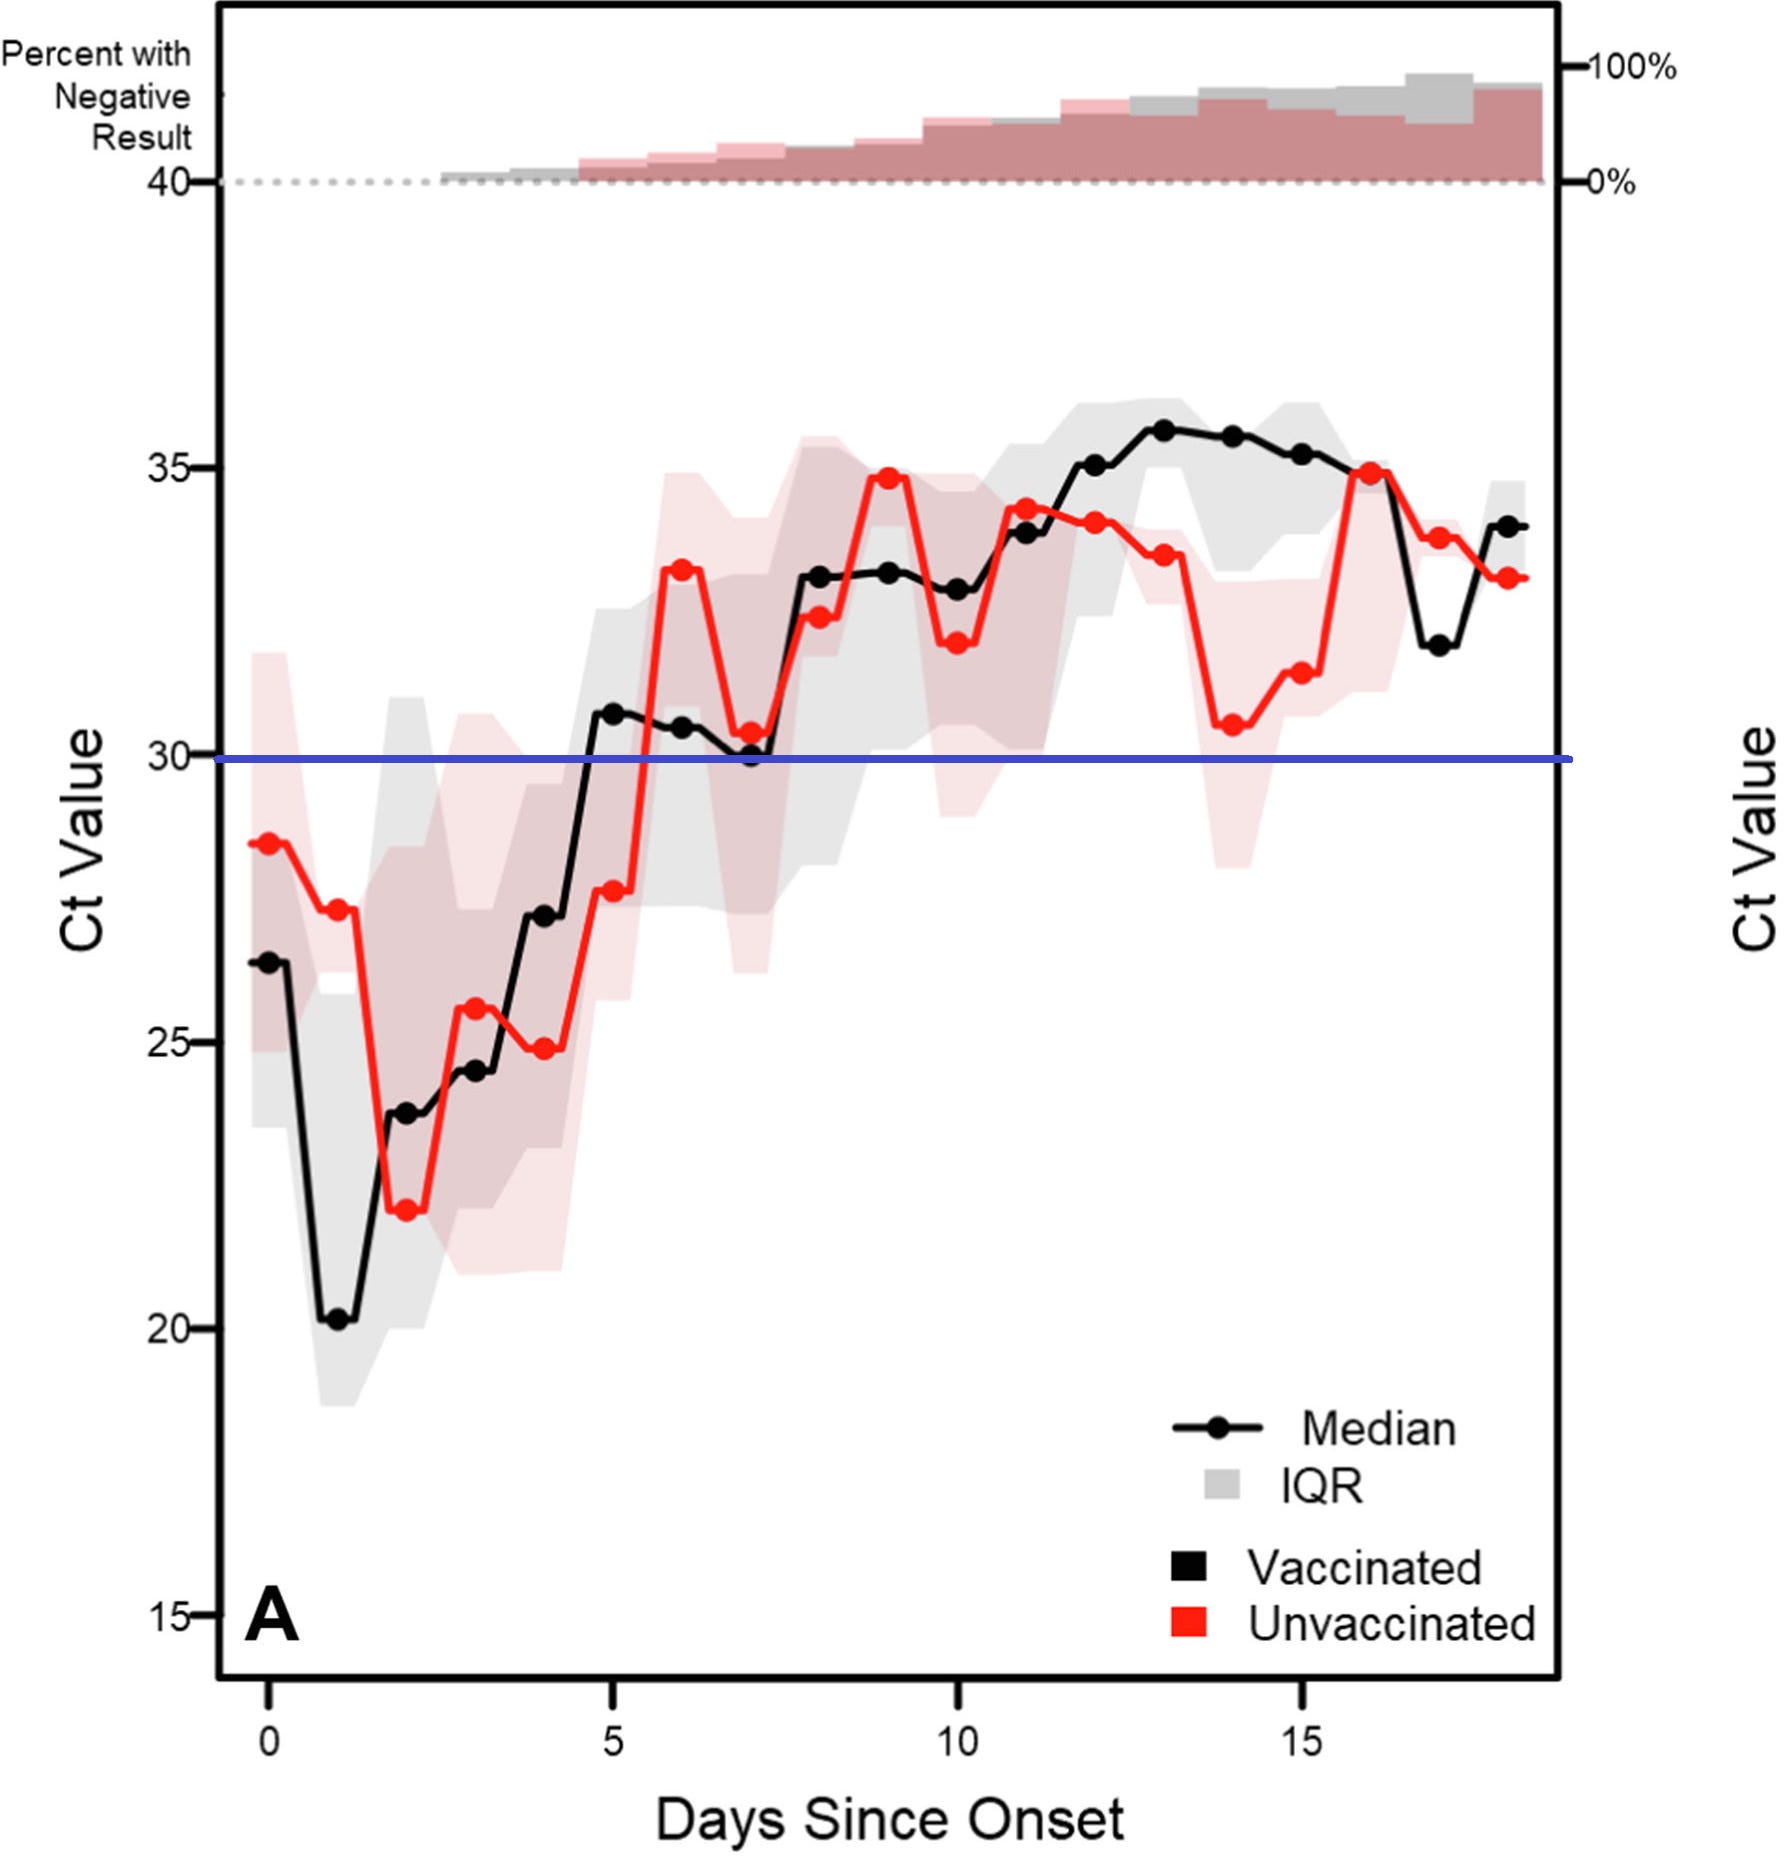
So it would appear that the authors attempted to subtly portray the unvaccinated as harboring more virus by leaving out the most significant chart and dumping it in the supplementary materials that are not part of the main study text. By leaving it out, the remaining charts they include in the study (these plus a bunch of others you can look up in the study itself) are adroitly weaved in to a far different narrative of the study’s observations.
And these people are paid from money taken off the dinner table of honest families.
Wow!