Did Any Women Die in 2020 *Because Of* Covid in Vermont?
Shockingly, the answer might actually be no.
PSA: I am writing a follow up article to go through the ‘accident’ deaths that I made a mistake on in my previous post on the VT death certificates (DC’s). Suffice it to say, despite my blunder, the signal is there, but it’s a bit more more nuanced.
How many women were legitimately killed by covid in Vermont?
This is a worthwhile nugget to explore. One of the more incessant propaganda blitzkriegs deployed by the Govt/Big Med complex to scare people about covid was “pregnancy is a [profound] comorbidity”.
To be clear, this was anyhow absurd simply because young healthy women - in other words, women who get pregnant - were statistically the safest cohort outside of kids.
However, this and similar arguments leave a little wiggle room for women with genuine comorbidities - perhaps there is an actual risk to them at least from covid, however otiosely slight.
But what if women simply were by and large never dying from covid in the first place?
I had always assumed that there were probably a small number of women who genuinely died because of covid, simply because between the 1-2 million (rough guesstimate) legitimate covid deaths (who mostly could’ve been saved with treatment), and the clinical experience of tens if not hundreds of thousands of doctors, surely there were some women who were covid disease casualties.
Which is why I was surprised to observe the following trends in the Vermont DC data for 2020 that suggest the possibility of negligible covid deaths among women.
To be clear, I am not claiming anything definitively, rather I am simply suggesting that the following observations suggest a realistic possibility that covid may not have killed any women in Vermont until the last week or two of December.
As Ms. Frizzle would say, “Buckle up everyone, we’re going on a field trip!”
Exhibit A: Excess Death from ALL Causes in 2020
Note: Make sure to read *all* the labels & axes on the charts, they are not always the same.
The following charts are the trendlines for excess deaths broken down by gender:
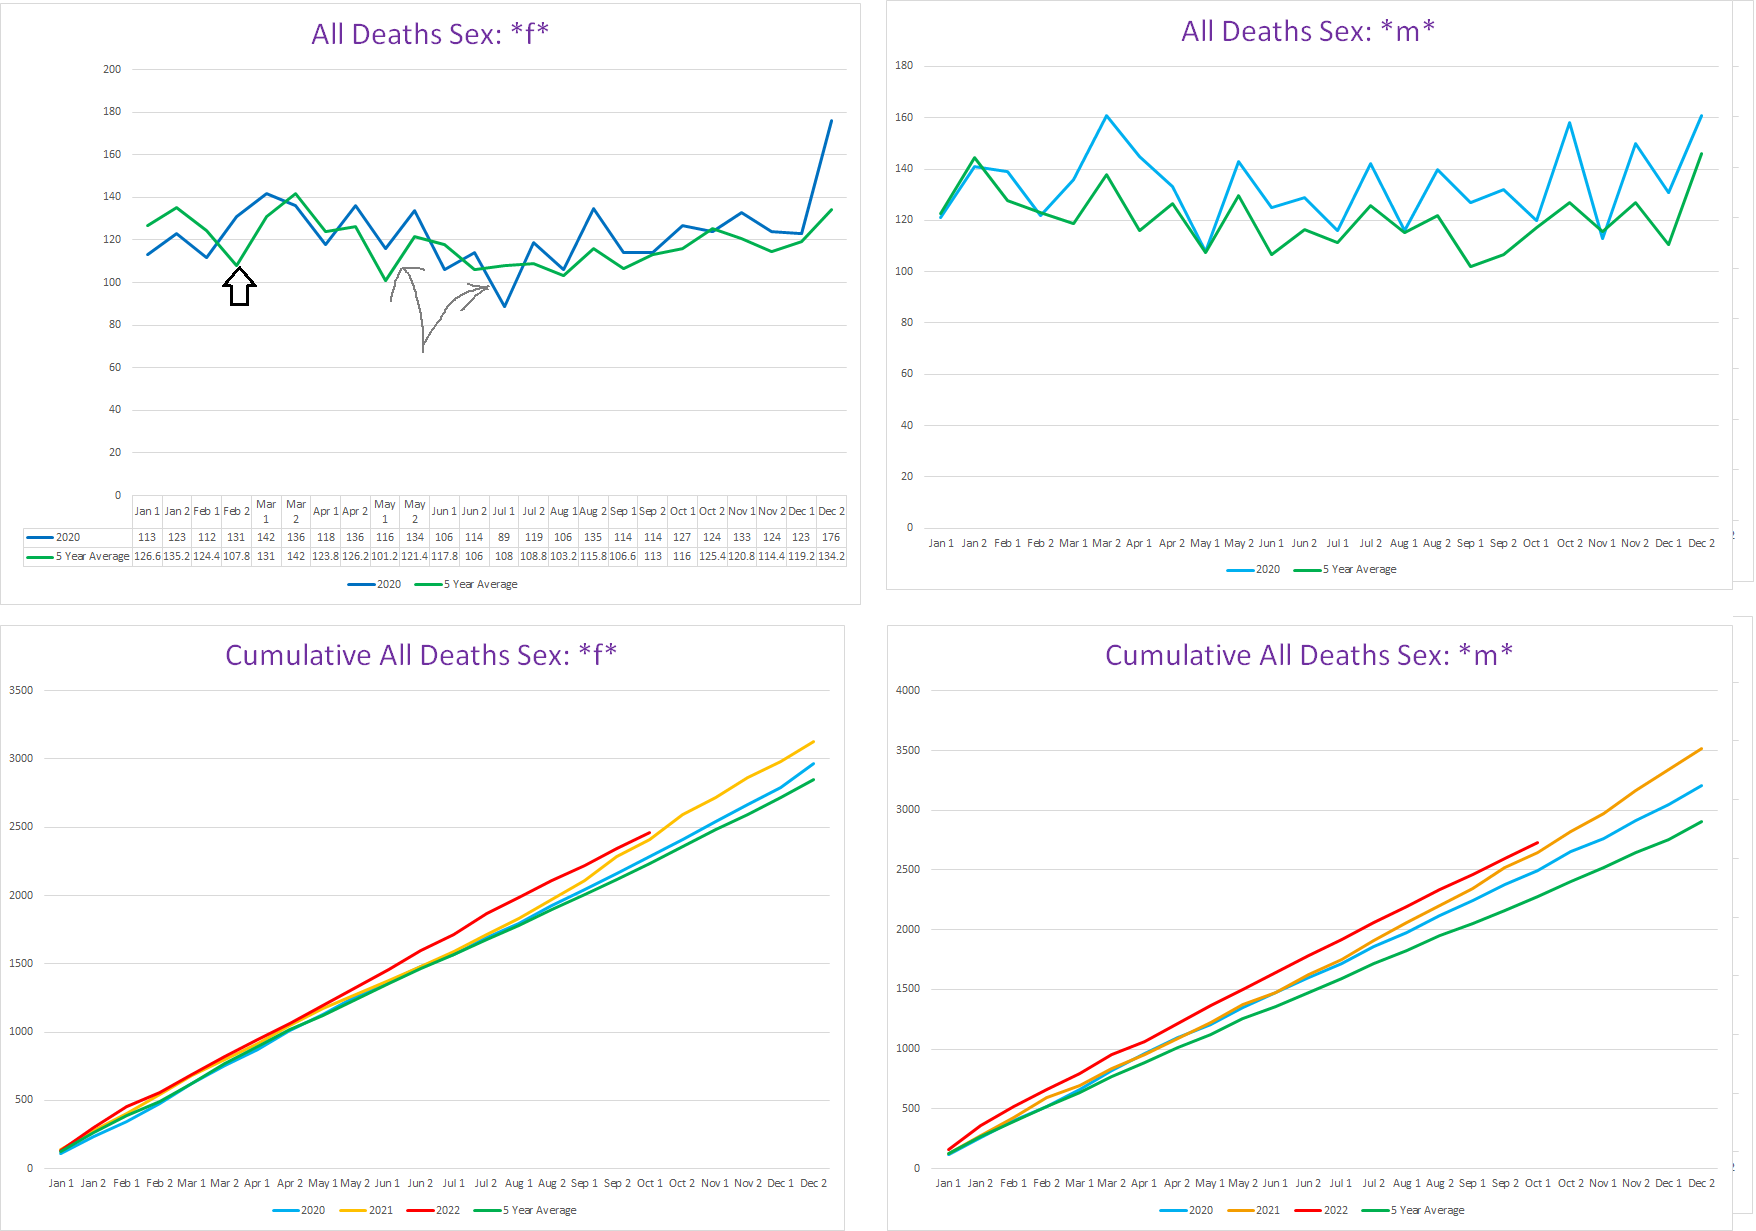
On the top left chart you can see that for most of 2020, there was nothing happening. Initially, there are a few minor bursts of excess death that basically amount to a ‘pull forward’ effect. First, indicated by the black arrow, about 30-40 deaths occur approximately two weeks ‘early’ during February. This little spike in excess death occurs before covid is officially acknowledged to be spreading in the US (we now know it had been spreading for many months by that time). Whether this was a bit of undetected covid hitting up a hospice or two, or some other variable that caused a bunch of old people to die (the excess is practically all over 60), offing a few dozen people already on their deathbeds does not count as ‘killed by covid’ for epidemiological purposes (by any sane standard).
The second ‘pull-forward’ minor burst of excess deaths is indicated by the grey arrows. The April-May slight excess in 2020 over the 5yr average is canceled out by the subsequent mortality deficit in the second half of June & July. This is reflected in the bottom left graph, where you can see that cumulative deaths for 2020 and the 5yr average are the same through August.
Contrast this to the right-hand graphs, where you can see that for the men, the first two bursts of excess death were larger, longer, and were never negated by a subsequent mortality deficit. In other words, these look like genuinely excess deaths that were not going to happen in 2020 at all. Furthermore, for men, pretty much the entire year of 2020 is above the 5yr average.
Going back to the women, starting in the second half of August, there is sustained, albeit fairly small, excess above the 5yr avg; something paralleled by the men but on a noticeably larger scale.
Is this August+ excess mortality from covid? Going by only the all-cause mortality excess, it is a reasonable hypothesis. Stay tuned, we shall return to this later.
Finally, in December, excess deaths explode for women. The most straightforward explanation for this is that it is the 2020 winter covid wave that hit pretty much every state to some degree. However, it is curious that the male excess deaths do not track in a similar pattern - for the men, the seasonal pattern of death is preserved, just 2020 there is more death happening in November & December for men but unlike the women the trendline is pretty consistent for that stretch.
Overall, there is obvious excess female mortality coinciding with the second wave of covid though.
Except.
Yes, something else also started in the latter half of December in Vermont:

In the first half of December, there were only 4 excess deaths in women - small enough to be a fluke.
In the latter half of December, where the 5yr avg is 134.2 female deaths, there was a whopping *176* in 2020!!1
So it stands to reason that the vaccines can also be a/the culprit here - whether by SAE’s or by the sharply negative efficacy against covid itself for the first few weeks following dose #1.
I suspect that at least some of these deaths are genuinely covid deaths, because the vaccine can’t kill you with covid in a day. However, we don’t know what we don’t know, and it is a bit superficially incongruous for women to completely escape covid wave one but then get covid wave two (and after the men seem to get their second wave mortality bump too for that matter).
Primary Takeaway from Exhibit A:
The first wave of covid only saw excess mortality in men but not at all in women; the second wave of covid does see excess female mortality but it also coincides with the initiation of the vaccine rollout to seniors in the state.
Exhibit B: Deaths involving a Pneumonia & other “pneum” conditions in 2020
The logical next step is to look at disease conditions that occur in patients with severe covid disease. If covid causes excess deaths to happen, then we should see a corresponding increase in covid disease-related conditions at the time such covid excess deaths are occurring.
The most prominent covid-associated respiratory condition is pneumonia (whether it’s covid pathophysiology organizing pneumonia or an opportunistic bacterial pneumonia).
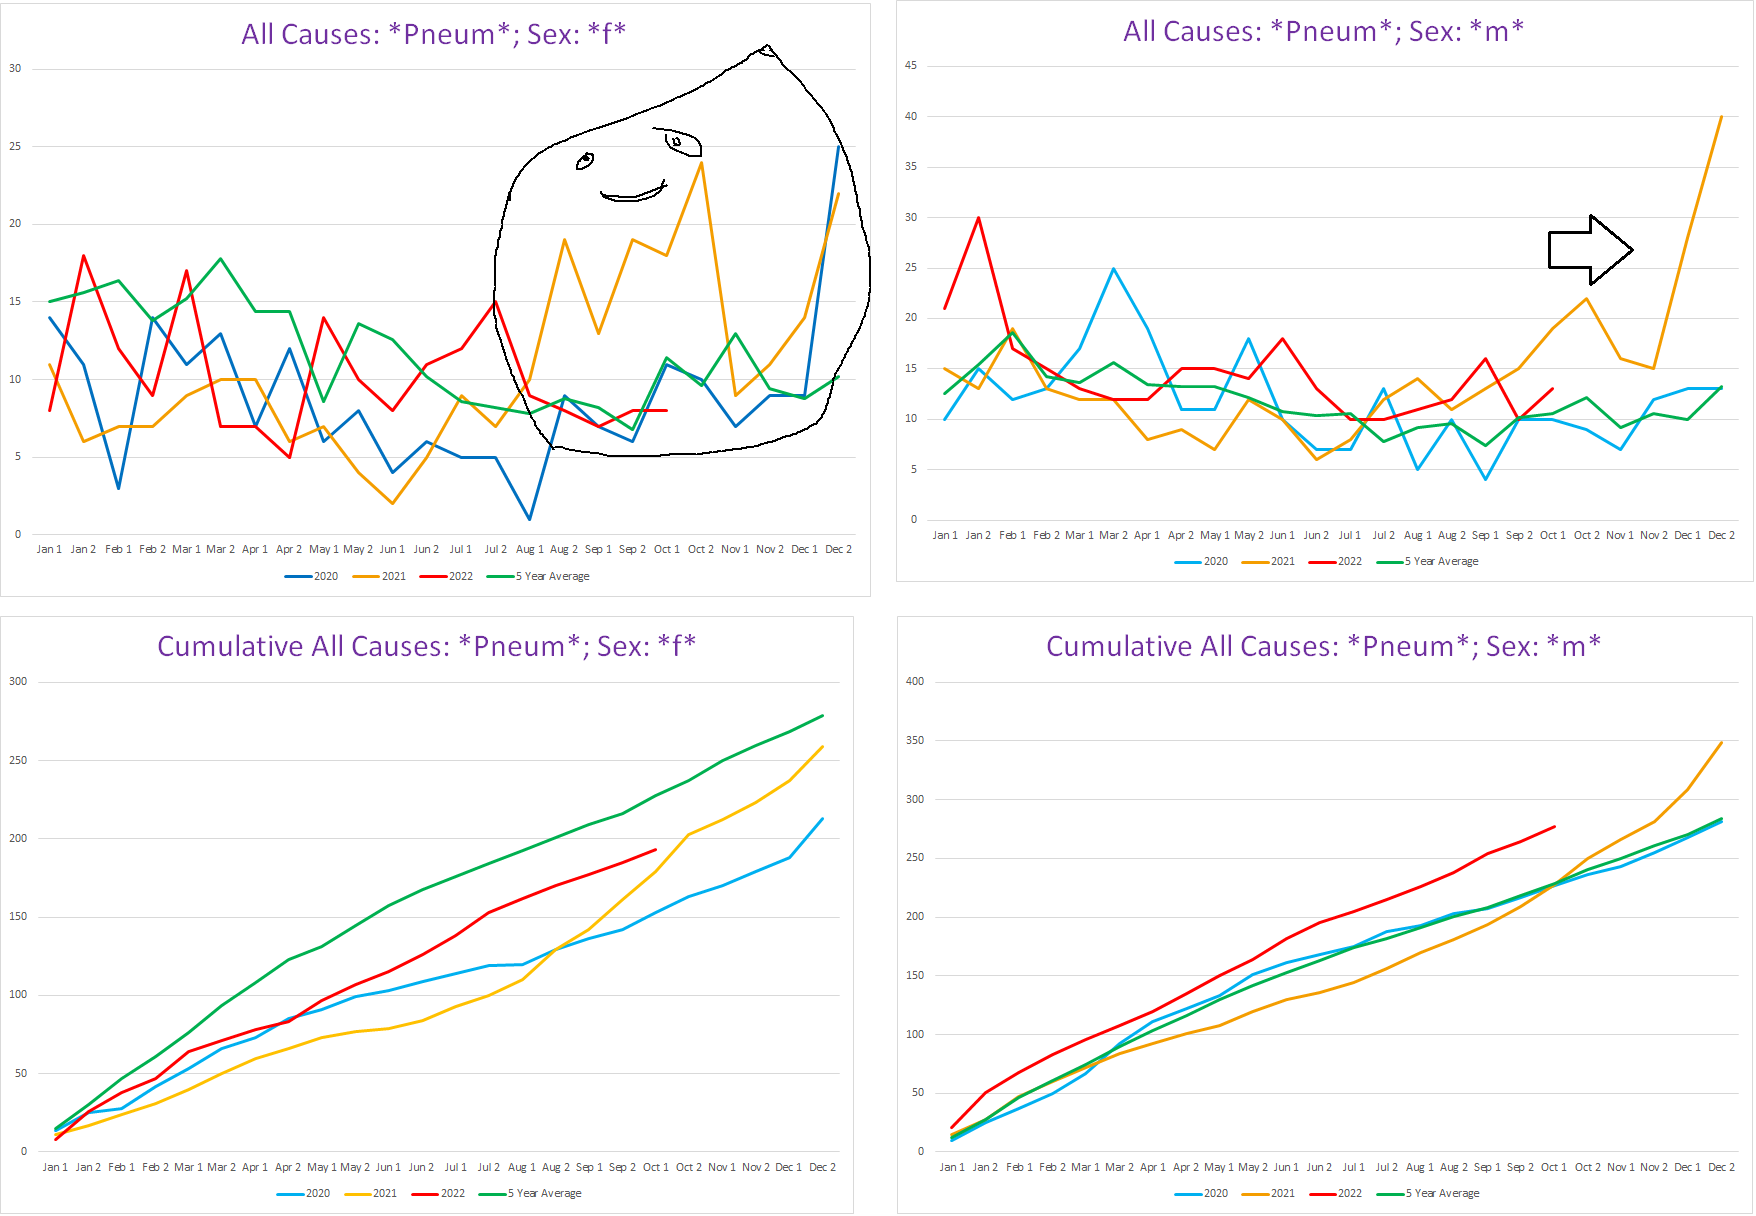
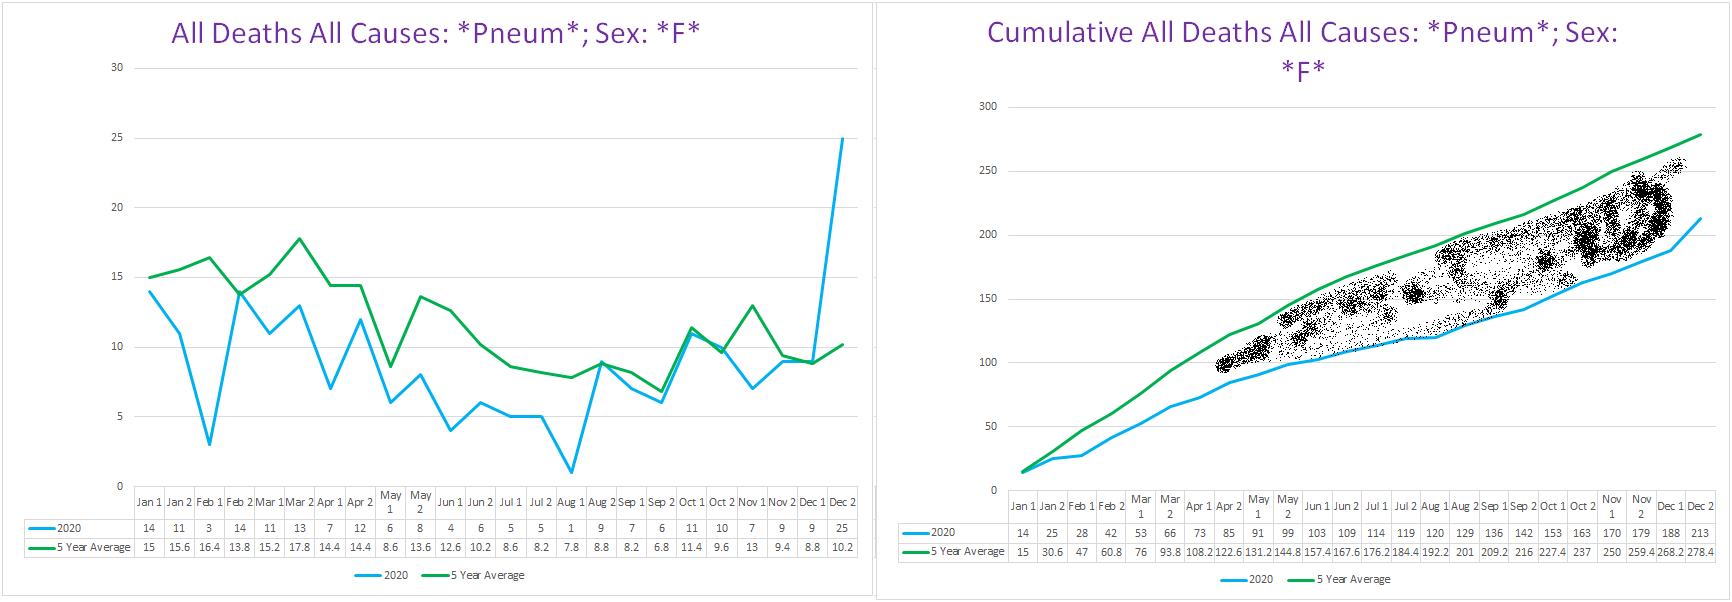
Let’s take the graphs on the left but without 2021 & 2022:
Now this is certainly odd. Until the second half of December, ladies were having a good year for pneumonia deaths, including during the first wave of covid!! Assuming the second covid wave excess deaths are covid, this is very compelling evidence that the first covid wave did not kill *any* women in Vermont at all. As we see from December, when covid kills, there is a rise in pneumonias.
To be clear, the trend for pneumonias was going down very consistently over the past 5 years:
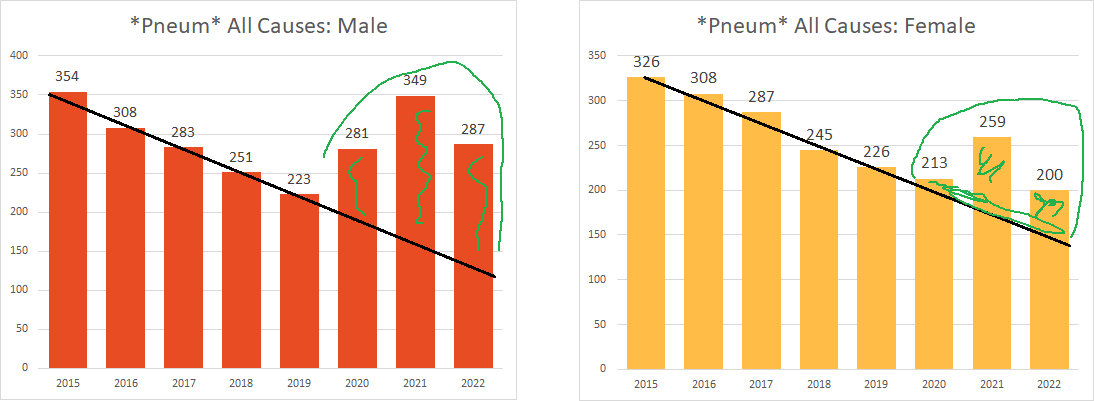
So the ladies were on pace to continue this trend in 2020, until December happened and poof. (I wonder if this trend maybe an artifact of changing convention how to record certain respiratory conditions by ME’s. Either way, pneum seems to track with covid well enough.)
Further bolstering this is that when you look at men, there was excess pneumonia deaths during the first covid wave, where there were excess deaths overall for the men (top right chart, see the inverted blue triangle towering over the green 5yr avg line during the first wave, and the green line should be a lot lower if it were accounting for the trend instead of the average which inflates the “expected” number of deaths involving pneumonia for 2020).
Contrast 2020 to 2021 (top left, yellow line) - in 2021, the women got absolutely hammered by pneumonias in stark excess, way out of season, and after they were pretty much all vaccinated.
Primary takeaway from Exhibit B
The pattern of “pneum” deaths seem to indicate that covid didn’t touch the ladies until the last two weeks of December… which is what seemed to be the case based on the overall topline excess death numbers in Exhibit A.
Yes, these numbers are small, but this observation definitely at minimum raises some serious questions.
Exhibit C: Deaths involving respiratory conditions
Another obvious candidate for covid associated disease condition is anything “respiratory”. As in Acute Respiratory Distress Syndrome (ARDS).
So what have we here?
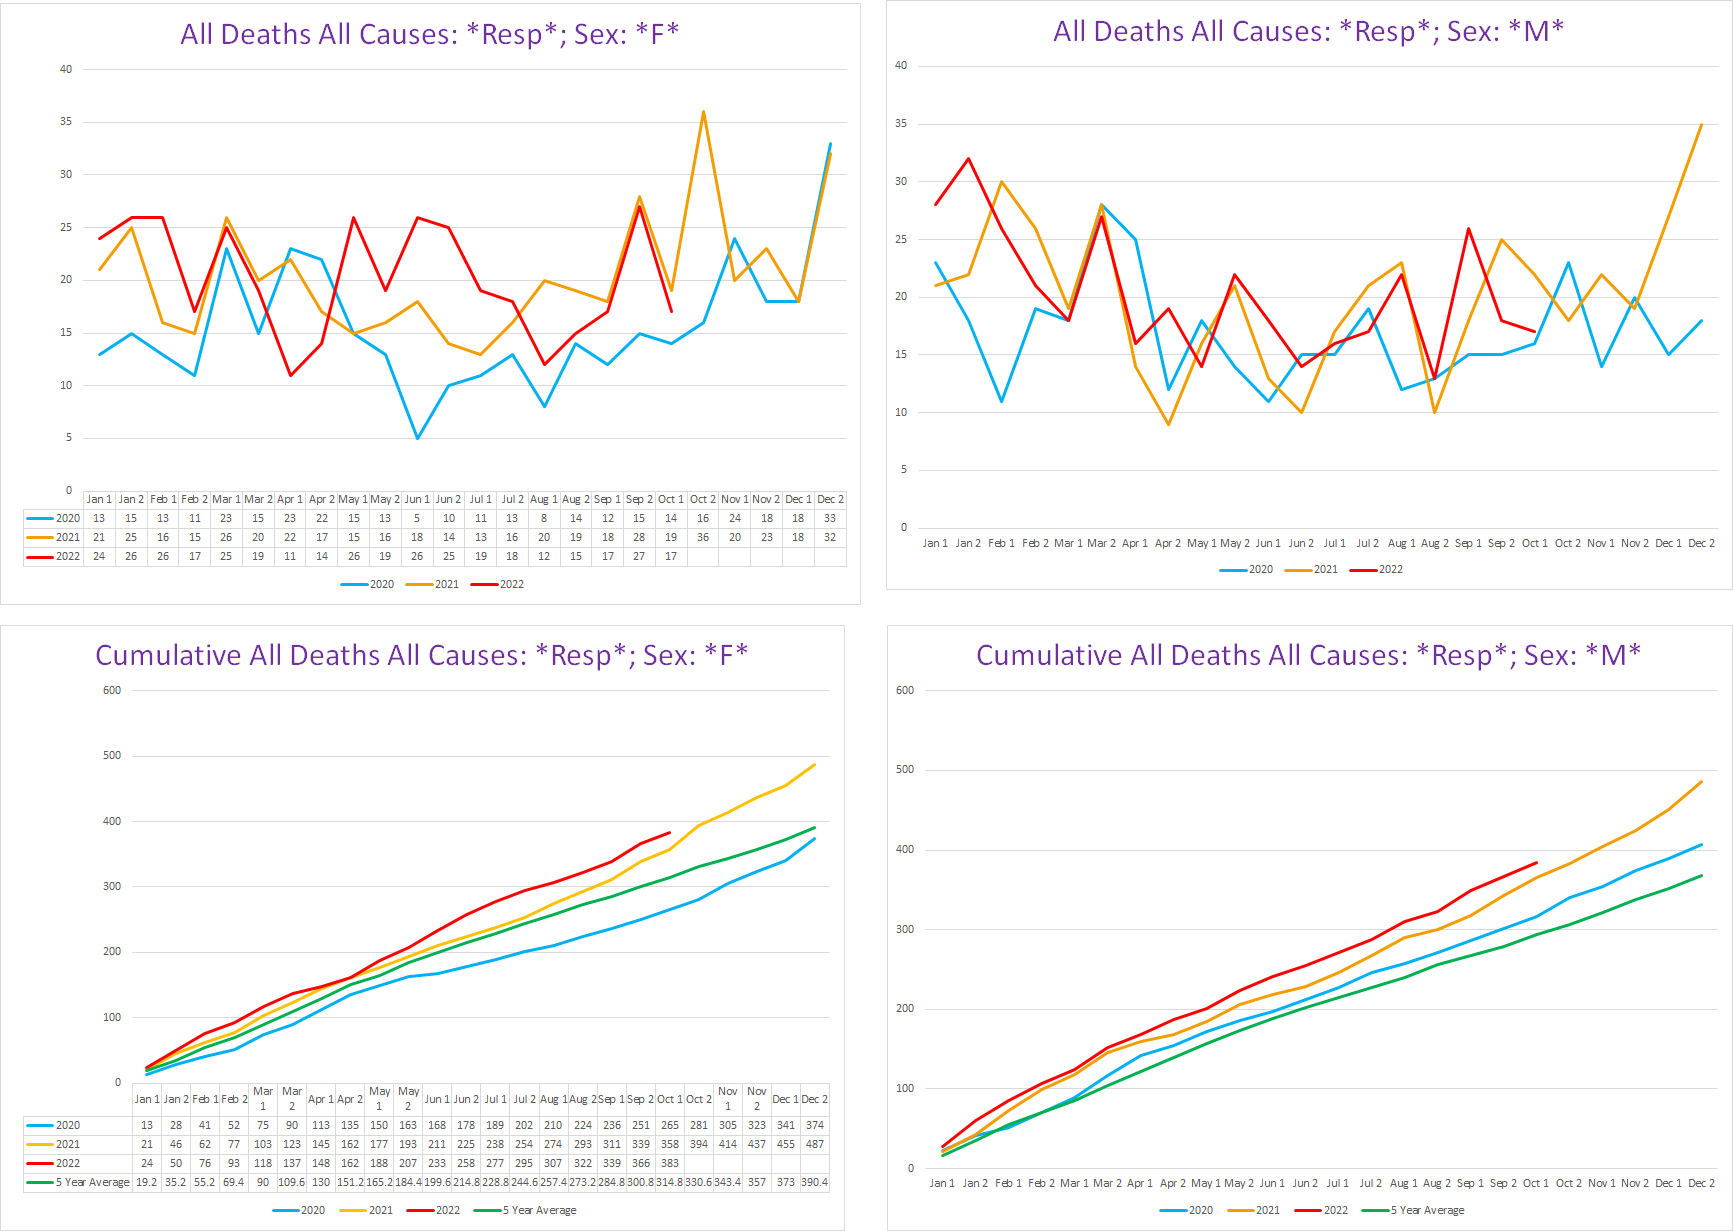
A tale of two genders indeed. We can see again excess in men corresponding with covid wave #1. Yet women, again, have no discernable excess at all.2
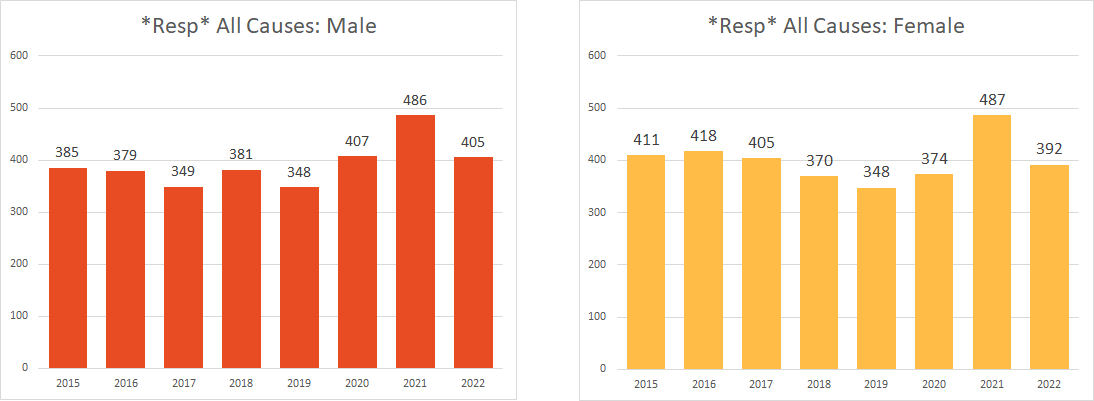
When looking at the total number of deaths involving a respiratory condition, you can see that 2021 & 2022 demolish 2020, and the previous 5 years (2022 is only through the first half of October, so it’ll end up way higher than shown below):
2021 shows us what a respiratory pandemic should look like. With the exception of the latter half of December, 2020 was definitely not that:
Main takeaway from Exhibit C
Respiratory conditions seems to show the same patterns as pneumonia did regarding covid - for the ladies, no discernable covid until the end of December when the vaccines also showed up.
Exhibit D: Deaths involving Pulmonary conditions
This rounds out the trifecta of major types of respiratory conditions.
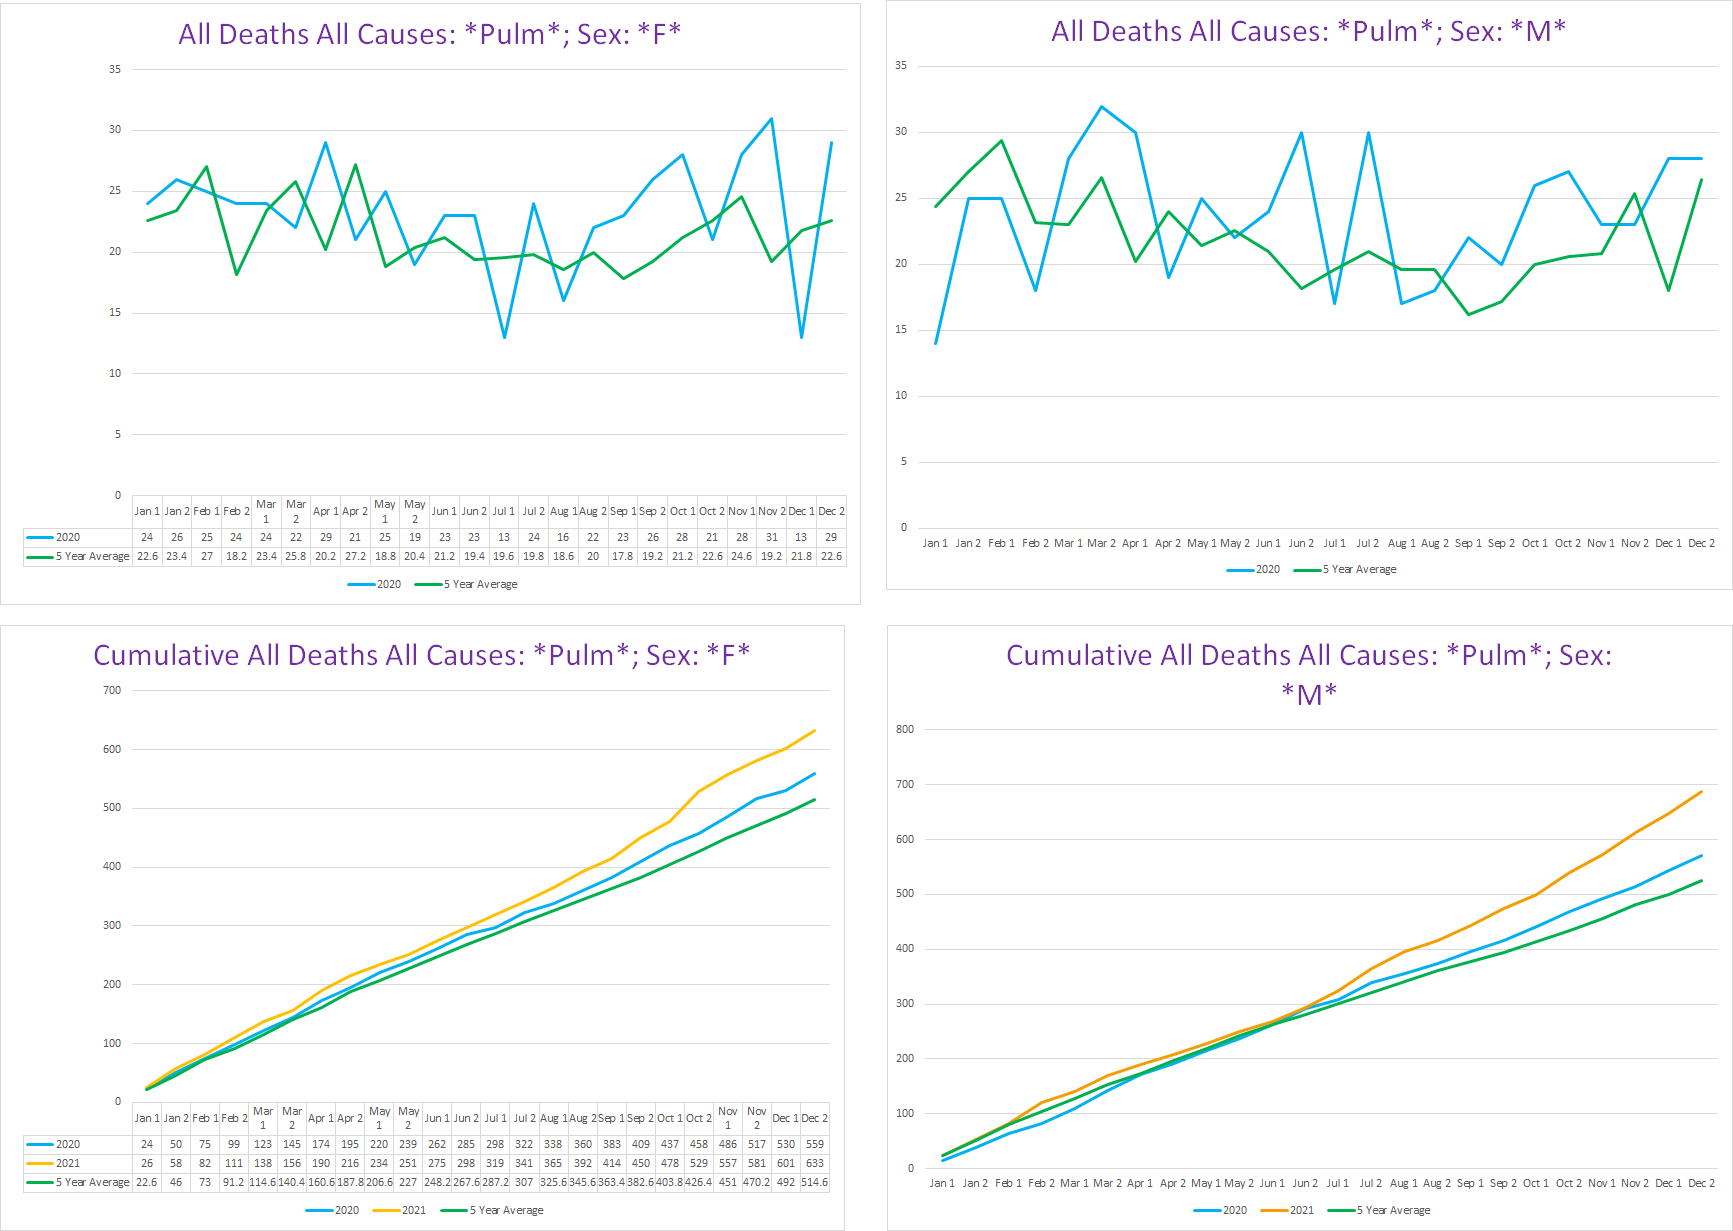
Pulmonary is the only one that shows any real excess for 2020 in women, although it is quite erratic:
The ping pong ball bouncing all over combined with the very small sample size makes me wonder if this is just noise for the most part. If we only had pulmonary conditions to go on, I would feel like there is too much uncertainty to assert the possibility that covid simply did not kill Vermont women at all by itself.
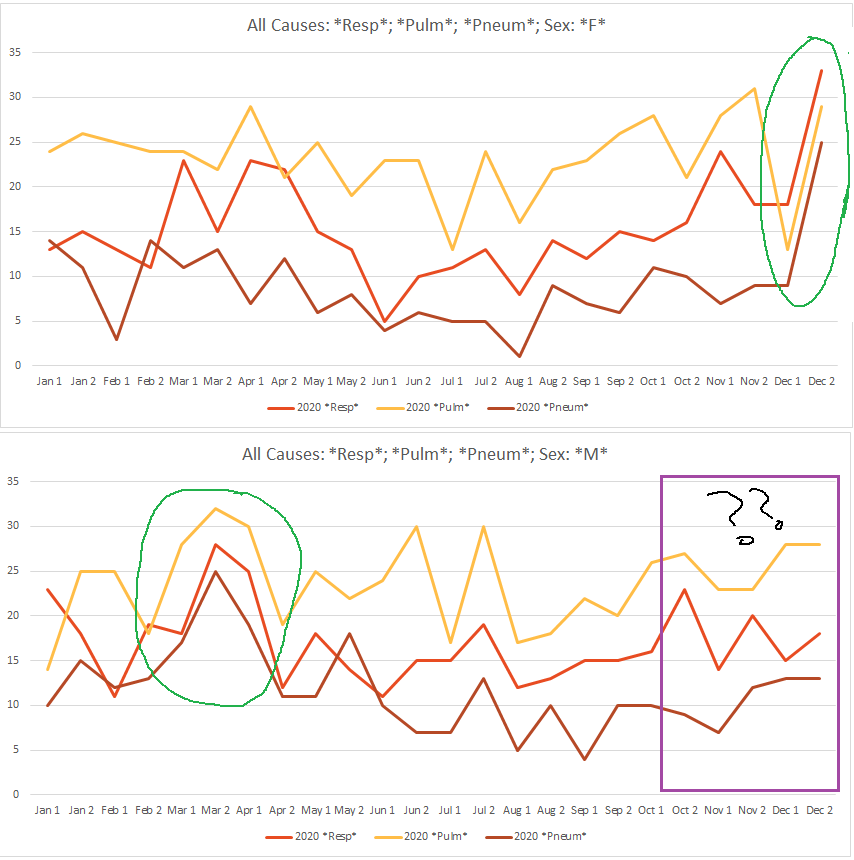
Furthermore, when you overlay all three of these respiratory categories together for 2020, this is what it looks like:
For the ladies (top), when covid hits, you see it clearly, as all three go “boom” in perfect synchroneity (circled in green). Similarly, we see the same for the men during the first covid wave (circled in green).
In other words, this seems to be covid’s statistical ‘fingerprint’.
The second wave by men is an oddity though - it seems to not actually happen. Or at least Vermont’s men did not die from covid during the winter wave when Vermont’s women did. It’s almost like they took turns. Since this is an article about women, I don’t want to get sidetracked into heading down a rabbit hole to dig through the male data to flesh this out, but it’s worth noting.
Pulmonary Embolisms
The pulmonary conditions get weirder:
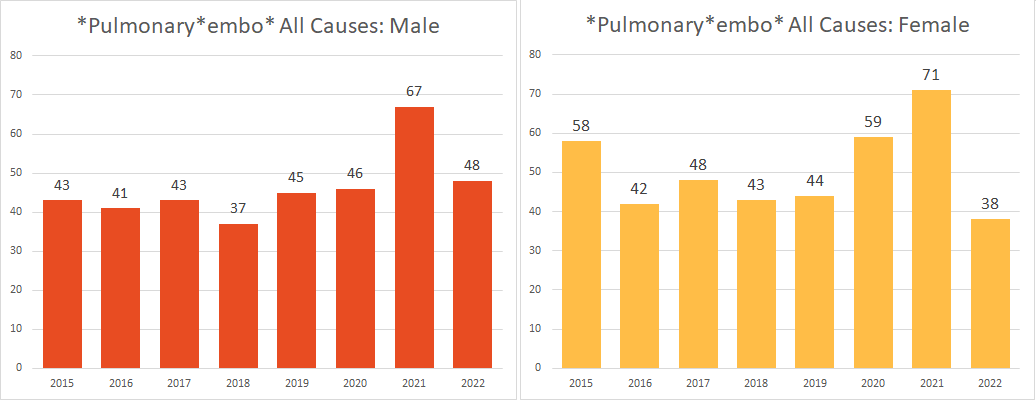
Pulmonary embolism is one of the most common covid disease complications. This was especially true for the native Wuhan strain that kicked off the pandemic. Yet there is no excess PE’s whatsoever for the men who definitely suffered a bit of excess mortality from covid, while there is definitely excess PE’s for the ladies.
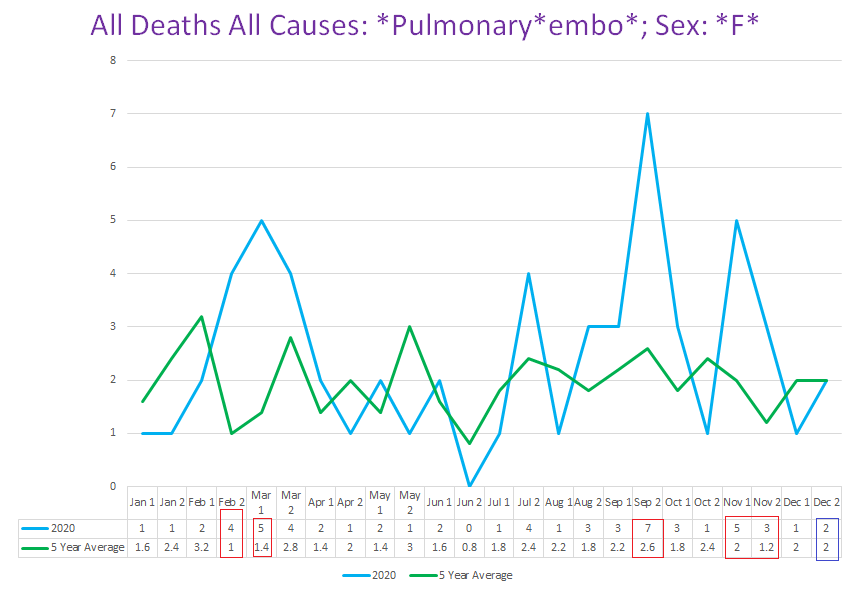
If we look at when the bulk of the female excess PE’s occurred, it doesn’t seem to be covid per se either:
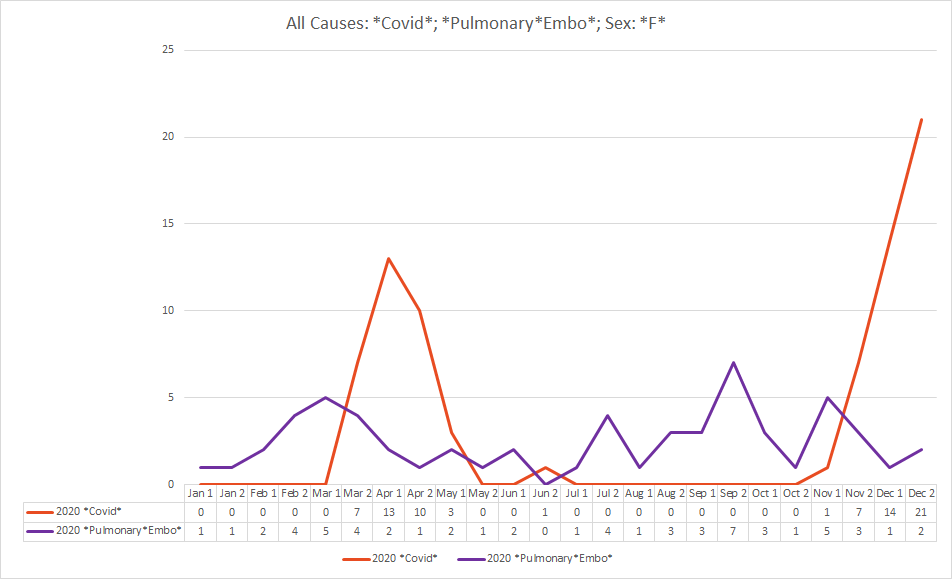
The excess is almost entirely from the red boxes. The first two were before covid officially swept in, the spike in September - 5+ above the 5yr avg - does not correspond to any other conceivable covid manifestation (and it would have to be a huge covid wave to cause PE’s to almost triple), and the mild November excess is similarly before the winter covid wave sets in for Vermont. Finally, when we overlay PE’s with covid, this is what we get:
Considering that anyone who died with a positive test - and surely so if they died at least in part because of the paradigmatic complication of covid disease - would get covid on their death certificate, the stark dissociation of PE’s and covid seen here strongly suggests that they may not be linked.
Which is of course odd in itself, but that’s for another time.
Primary takeaway from Exhibit D
I’m not sure what to take away, because the data seems a bit too erratic. While there is a bit of clear excess pulmonary deaths, it doesn’t seem covid per se until the end of December.
Exhibit F: Deaths mentioning covid on the death certificate
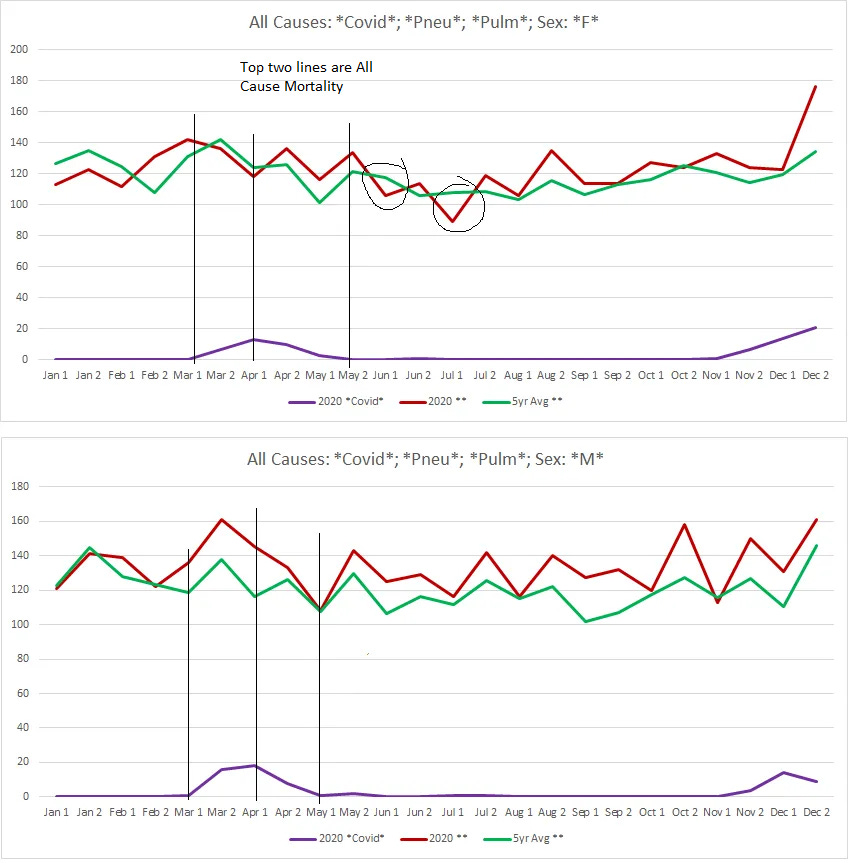
So how do the (alleged) covid deaths stack up to all this? Here’s how covid deaths stack up to the trend in al cause mortality for 2020, and the all cause mortality 5yr average:
Whereas for the men, covid wave #1 coincides with spiking excess death over the baseline from the previous 5 years, this is not the case for the women, where at best it seems that covid might be responsible for hastening a few old ladies to the grave by about 2-3 weeks or so (I circled the subsequent mortality deficits in black) - like we observed at the beginning with the all-cause mortality.
Conclusion
Based on these observations, it certainly seems as though covid might not have targeted the ladies in 2020 at all… until the vaccines were deployed.
It could be that the excess at the end of December is pure covid, and not covid supercharged by dose 1 of an mRNA elixir. But it also may not be.
Granted, these are pretty small sample sizes, and this does not by itself prove anything. What it does do is raise some profound questions that it may legitimately be the case that covid didn’t kill any women in Vermont who weren’t already standing with “one foot in the grave and the other on a banana peel” (and even those women may have elided covid’s vengeance).
Basic prudence, and honesty, should mandate further investigation to unwind this picture, because women - especially pregnant / reproductive women - were mercilessly and relentlessly targeted with overwhelming pressure to get a vaccine for covid. The mere fact that there is any possible ambiguity that covid actually killed any women in Vermont in 2020 itself completely undermines any ethical justification for bullying or coercing women to take a vaccine for covid.
Interestingly, there is a bolus that is definitely out-of-season in November for the ladies, which corresponds to the slight burst of excess mortality seen in Exhibit A at that time. I don’t think this is covid though - I went through most of the individual cases here, this is a sampling of what these death certificates look like:
Acute Respiratory Failure Chronic Interstitial Pulmonary Disease
acute respiratory failure pulmonary embolism multiple cerebral infarcts probable metastatic lung cancer deep vein thrombosis, atrial fibrillation
Acute Hypoxemic Respiratory Failure Fluid Overload Acute Myeloid Leukemia
Hypercapnic Respiratory Failure End Stage Chronic Obstructive Pulmonary Disease Tobacco Abuse --- Paroxysmal Supraventricular Tachycardia with Demand Subendocardial Ischemia, Hypothyroidism
Respiratory Failure Hypotension Critical Aortic Stenosis --- Severe Anemia, Acute Gastrointestinal Bleed, Chronic Obstructive Pulmonary Disease
Cardiorespiratory arrest Cerebral Infarction Hypertension Hyperlipidemia Alzheimers
Acute hypoxic respiratory failure acute on chronic pulmonary emboli metastatic stage 4 urothelial carcinoma of bladder
cardiac arrest respiratory arrest Flash pulmonary edema diastolic heart failure sleep apnea, morbid obesity, chronic renal failure
acute respiratory failure Pleural effusion Esophageal cancer --- Atrial fibrillation, hypertension, chronic kidney disease stage 4
Cardiac Arrest Respiratory Arrest Parkinson's Disease --- Dementia
Respiratory arrest Lung metastases Metastatic colon cancer --- Severe nausea, decreased appetite, malnutrition, dehydration
Respiratory Failure Pulmonary Edema Hypertension and End Stage Renal disease Type 2 diabetes Heart failure, Coronary artery disease
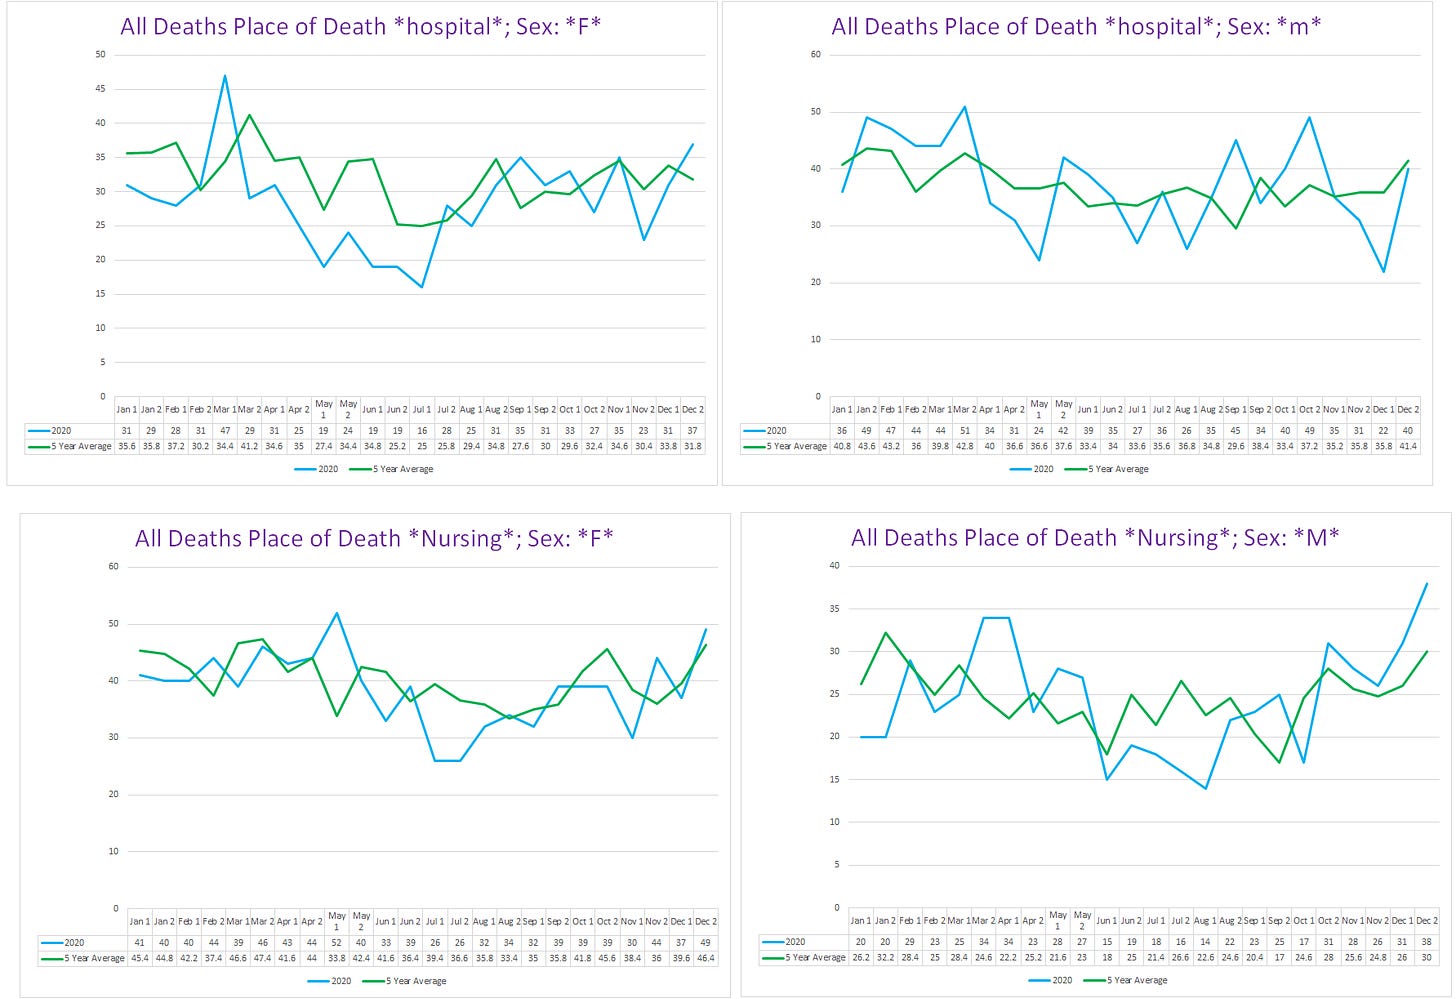
These are mostly people who were quite ill and were ‘pushed’ over the edge by something. I think that a more likely explanation is reduced care given for their prior conditions as a result of pandemic behaviors and policies.



MY god, there is no greater gift than what you are giving us through the clarity and inclusivity of your writing. Thank you.
Excellent presentation. Thank you!!!
I’m curious about New Hampshire stats lately. Apparently they allow HCQ or ivermectin... lol. I can’t remember which.
I wonder what’s going on there with cases/mortality etc compared to other states now.