Nursing Home & Long Term Care Facility residents are concealing bombshell excess mortality in SENIORS in 2021/22, including ~15-20% excess mortality from cancer
NH/LTC residents were wiped out in 2020, creating a massive Simpson's Paradox in the mortality data of seniors due to the subsequent (relative) mortality deficit in NH/LTC residents
As a general rule, excess mortality is much more noticeable in younger people than it is in seniors for a few reasons:
Since there are fewer deaths in younger people, even a small number of excess deaths stand out
For the same reason, it takes fewer excess deaths to reach statistical significance in younger people, meaning that we can have more confidence that excess deaths seen in data represent real-world clinical phenomenon as opposed to random statistical chaos or noise, or some freak coincidence
Excess death in younger people is a bigger story because it is more tragic when younger people die than it is when older people die (of course it is still tragic when older people die)
Thus, while the spate of “sudden deaths” in young people is often a top trending topic on twitter, very little attention is given to excess mortality in seniors.
However, there are still far more excess deaths in seniors than in younger people. It’s just that they’re more hidden. This doesn’t make the excess senior deaths any less of a moral travesty though.
I discovered what seems to be a big iceberg of excess mortality among people ages 60+ - particularly 60-89 - that is almost completely invisible because NH/LTC resident deaths are combined with deaths in NON-NH/LTC residents.
Minnesota death certificates contain two fields that make it possible to (mostly) segregate deaths into Nursing Home/Long Term Care Facility residents and Non-NH/LTC residents:
residence_nursing_home_y/n - a yes/no field where ‘yes’ indicates the decedent lived in a nursing home (but not that they necessarily died there)
place_of_death_type - indicates the type of place where the decedent actually died; one of the options is ‘Nursing Home/Long Term Care Facility’
Separating out the NH/LTC residents from the NON-residents revealed a MASSIVE Simpson’s Paradox (to be explained in a bit) severely distorting the mortality trends.
(Unfortunately, since there isn’t a field for LTC residents, we can’t separate out the people who lived in a LTC but died outside of the LTC in a hospital or hospice, which for nursing home residents ages 60-89 is about 5-8% of all deaths depending on the year.)
The gist of this article can be conveyed in a three-chart series:
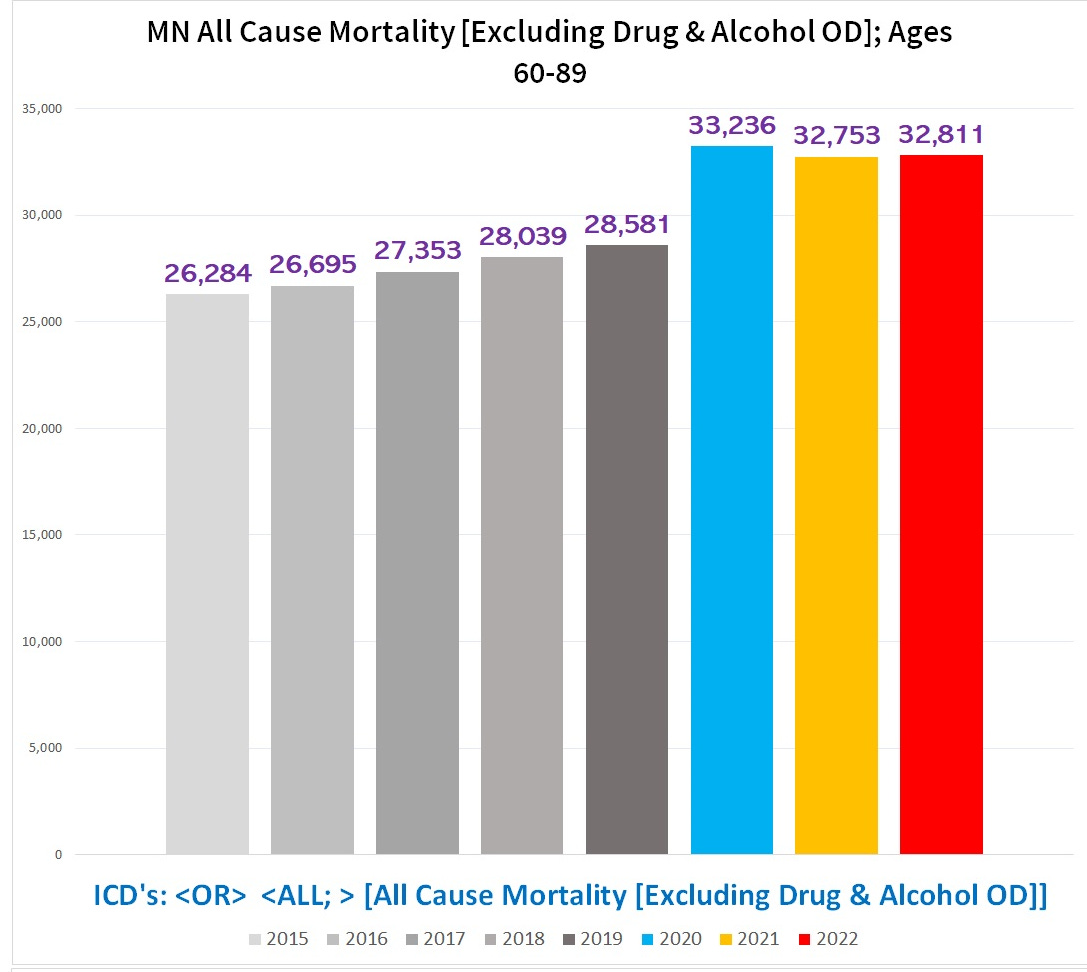
Chart #1 - Total number of deaths, ages 60-89
There are fewer total deaths ages 60-89 in 2021 and 2022 than there were in 2020:
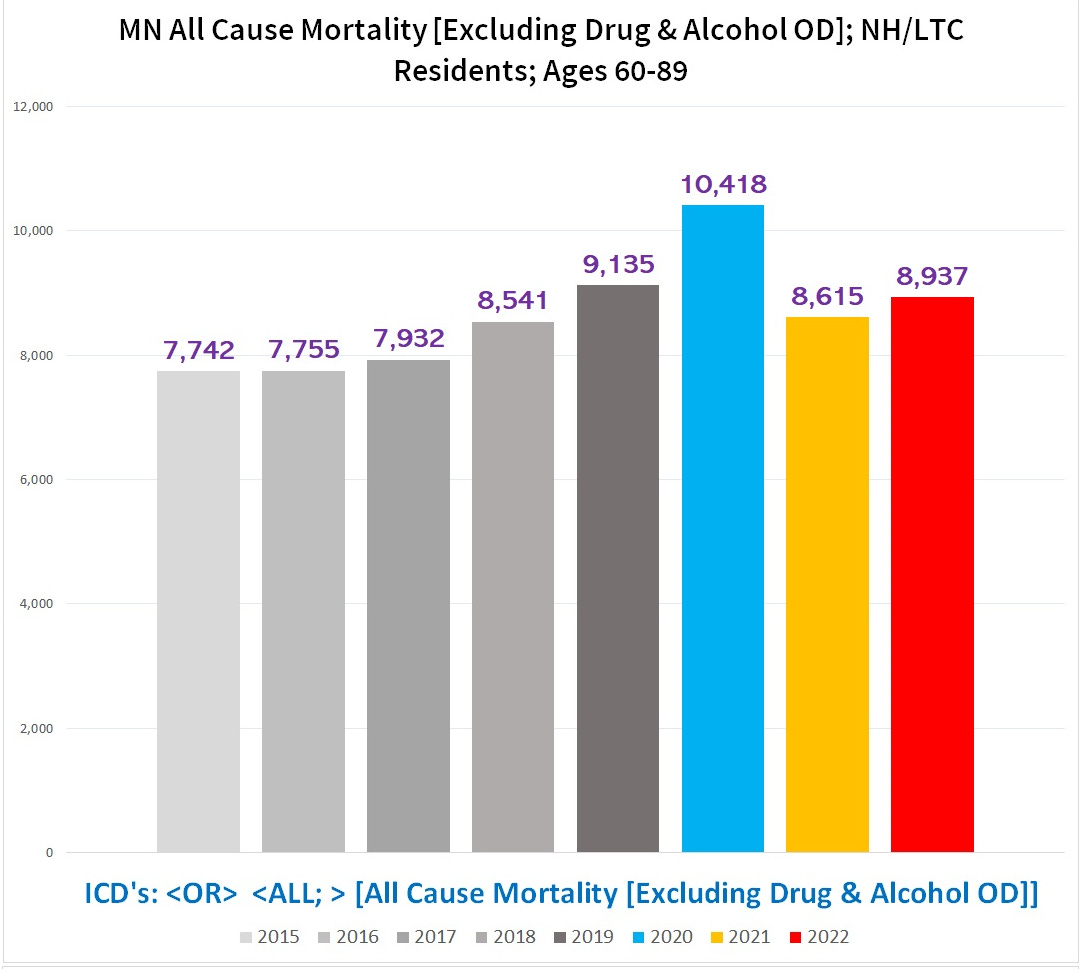
Chart #2 - Total number of deaths in *Nursing Home / Long Term Care Facility residents* (NH/LTC) ages 60-89:
For NH/LTC residents, the total number of deaths drops off a cliff in 2021/2022 compared to 2020:
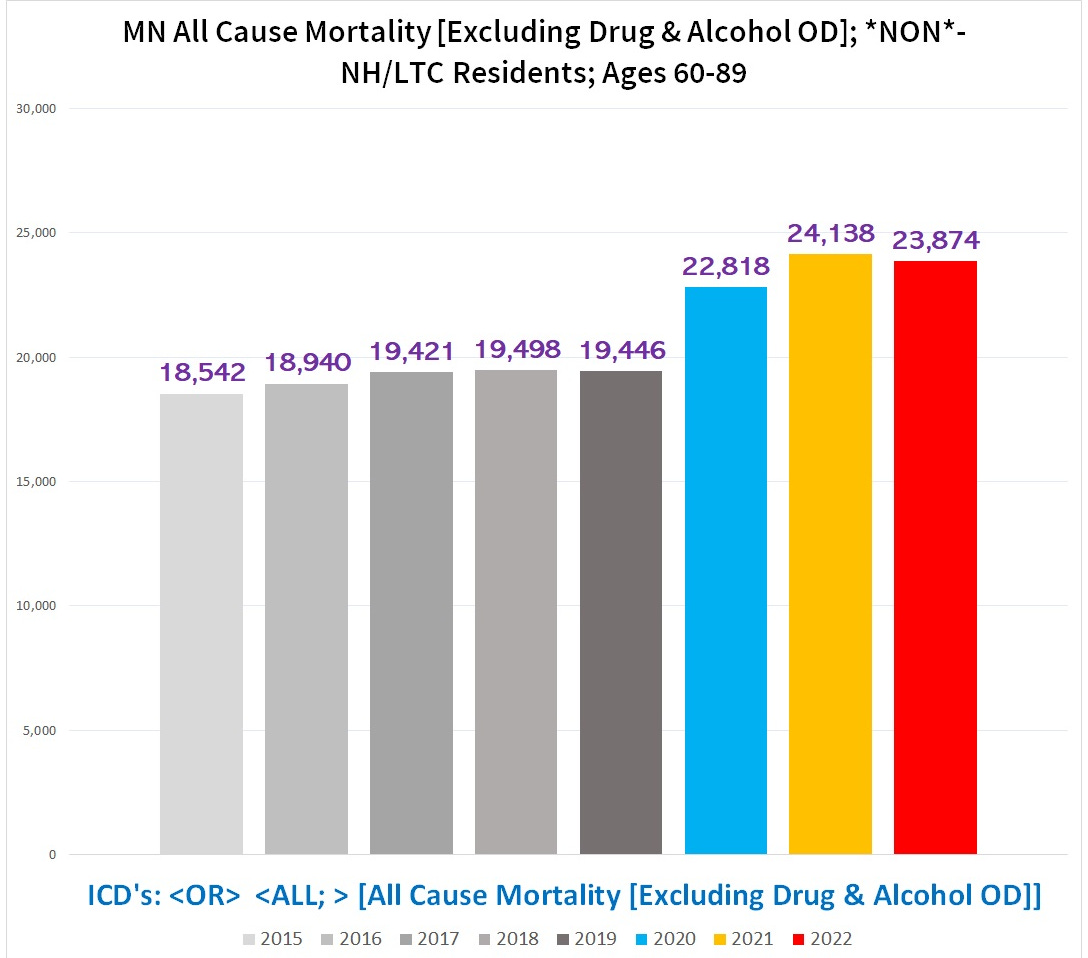
Chart #3 - Total number of deaths in **NON**-NH/LTC RESIDENTS, ages 60-89:
Conversely, for the **NON**-NH/LTC residents, there are MORE deaths in BOTH 2021 & 2022 than in 2020:
Combining the deaths from NH/LTC residents & non-residents alike into one big statistic is akin to combining the drug overdose death rates of crack addicts and nuns into one statistic and claiming there’s an epidemic of nuns dying of drug overdoses.
This statistical quirk is actually a known phenomenon called a “Simpson’s paradox”. (So of course, it is one of the favorite statistical manipulations used by the regulatory bodies, Pharma, and captured scientists to disappear negative results or fabricate positive data when necessary.)
What is a “Simpson’s Paradox”?
In (hopefully) plain English, a Simpson’s paradox is where combining multiple groups into a single group statistic changes what the data shows. In other words, on an aggregate, general or overall level there is one trend or number, but when you break it down into smaller subsets or groups, you find a completely different or even opposite trend or number in one or more - or even *all* - of the smaller subsets or groups than the trend or number you see when you combine all the groups.
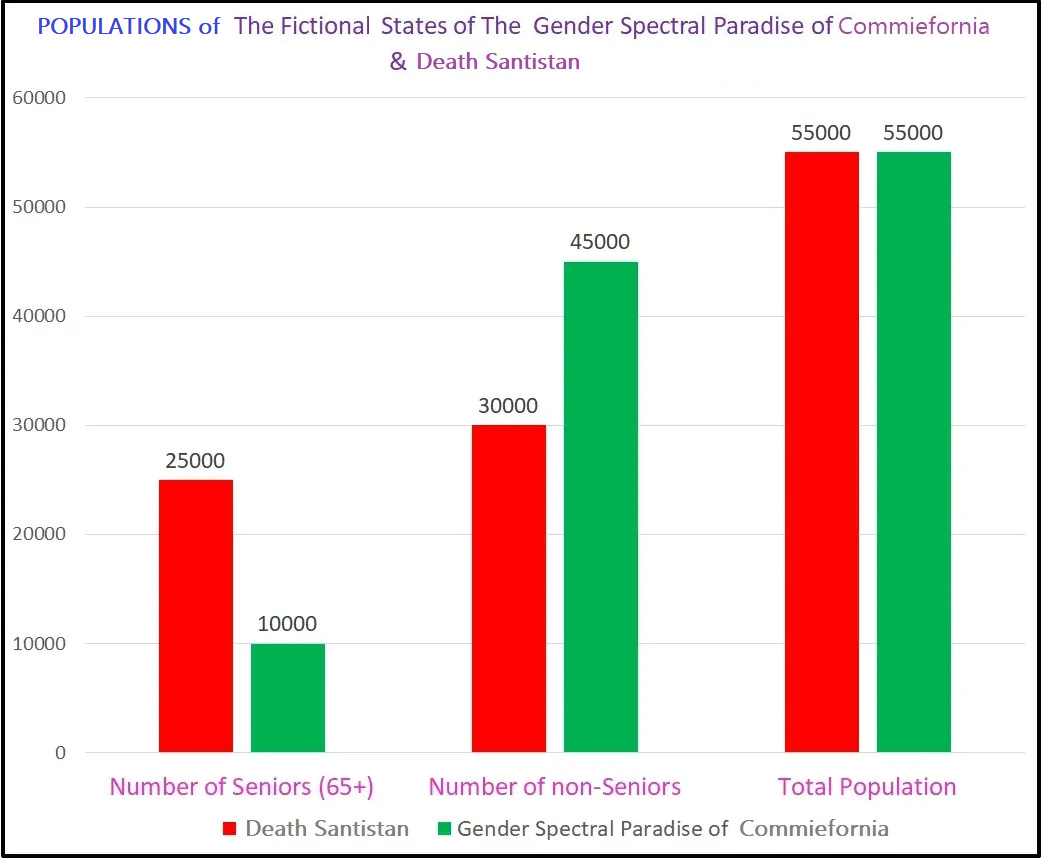
Suppose we want to compare the death rates in two states - the bad, evil state of Death Santistan & the good, virtuous state of The Gender Spectral Paradise of Commiefornia (GSPC).
The senior (left columns), non-senior (middle), and total populations (right) of each each state is shown below (Death Santistan in red; GSPC in green):
Although they have the same # of citizens in each state, Death Santistan has far more seniors and far fewer non-seniors compared to the Gender Spectral Paradise of Commiefornia.
Now suppose a pandemic of a Dreaded Disease struck the country one year, resulting in lots of deaths.
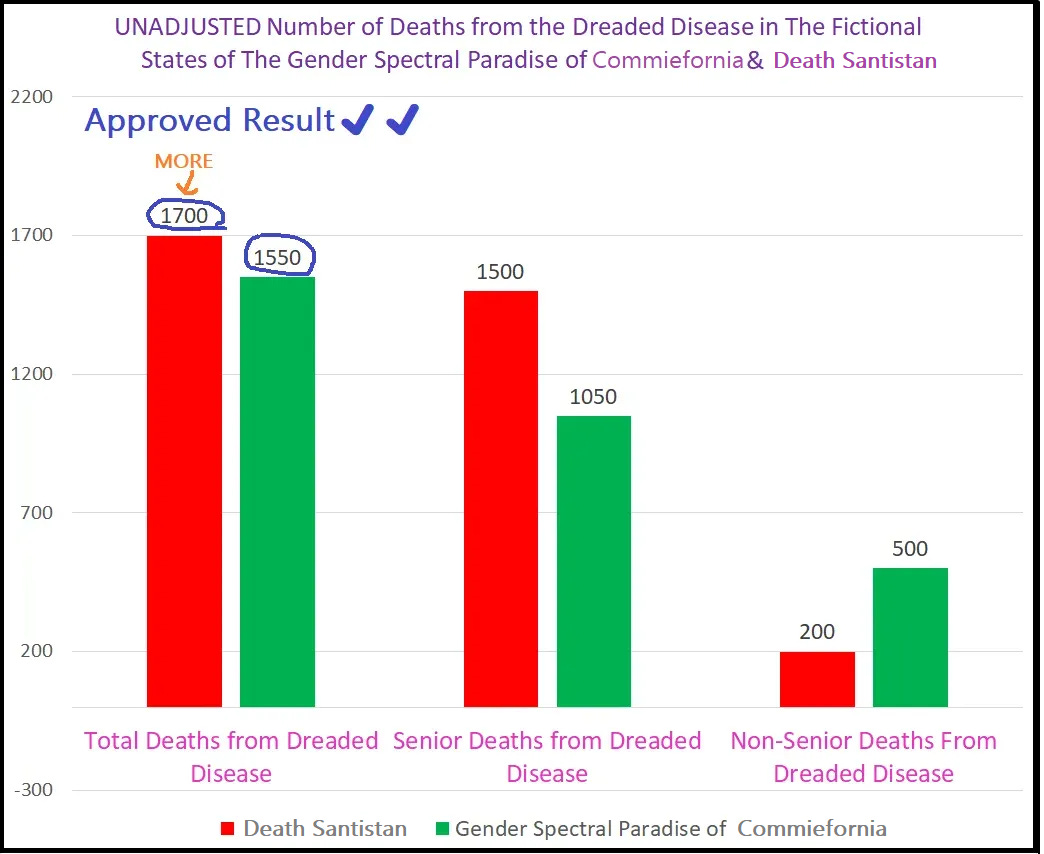
The following chart shows the total number of deaths (left columns), the number of deaths in seniors (middle columns), and the number of deaths in non-seniors (right columns) for both states.
As you can see, Death Santistan has more *TOTAL* deaths and more senior deaths than the GSP, but fewer non-senior deaths compared to the GSPC:
Since they have the same population size - 55,000 people - the % of people who died in Death Santistan is higher than the % of people who died in GSPC:
Death Santistan: 1,700 deaths/55,000 population = 3.09% died
GSPC: 1,500 deaths/55,000 pop = 2.82% died
Superficially, this looks like GSPC fared better than Death Santistan, because they had fewer deaths.
BUT. . . (yes, there is a big ‘but’ here)
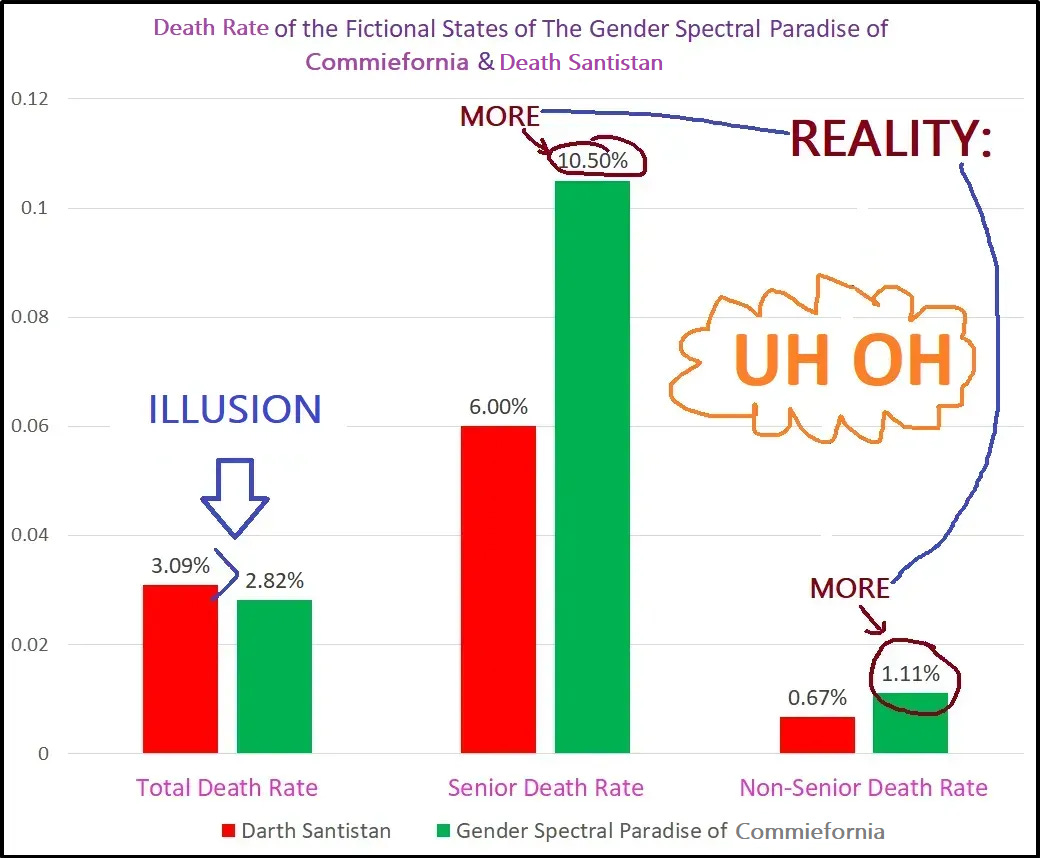
If we look at the % of people that died in the senior population and non-senior populations separately, shockingly, the GSPC has a higher death rate in BOTH seniors AND non-seniors compared to Death Santistan, despite having a lower % of people who died when you combine both populations together:
(**If you are a regime that needs people to believe that Death Santistan is a hellscape of death and misery compared to the paradise of the GSPC, you can’t afford to have pesky peasants and plebes discovering this information.)
How can it be that Death Santistan has a a LOWER % of deaths then the GSPC in both seniors and non-seniors, but when you combine the seniors and non-seniors into a single statistic Death Santistan has a HIGHER % of deaths??
Simple - it’s a classic Simpson’s Paradox.
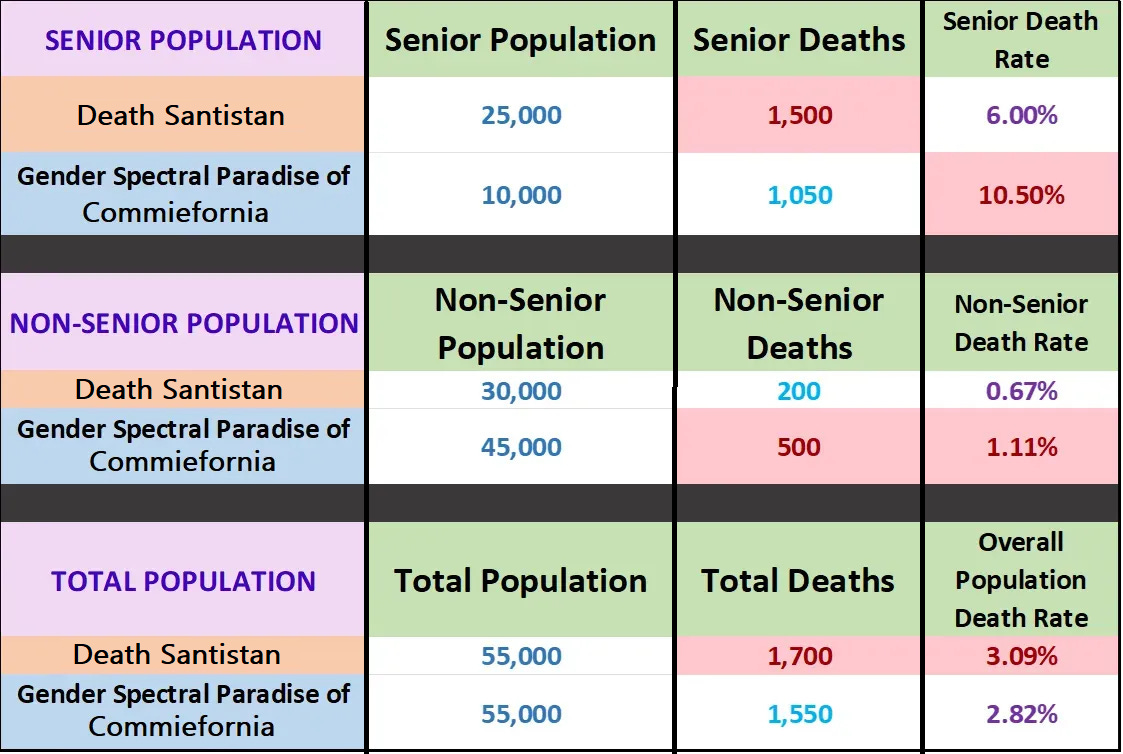
This is visualized in the following table (state with higher total in each death category highlighted in red):
The reason that a larger % of people died in Death Santistan despite having lower death rates in each age cohort is pretty straightforward - seniors die far more often than non-seniors. Since Death Santistan has the misfortune of 2.5x as many seniors as the GSPC, it has a lot more deaths overall because there are so many more seniors living in Death Santistan compared to Gender Spectral Paradise of Commiefornia.
This is why in the real world, Florida’s crude rate of deaths per 100K people is so high but their age-adjusted rate is far lower - Florida has a much higher % of senior citizens in their population, and seniors tend to die far more often than non-seniors. When you adjust for the age of Florida’s population, the rate of deaths per 100K people goes down from ~1,187/100K to ~803/100K - a stunning 32% decrease (!!):
What is the significance of the Simpson’s Paradox created by NH/LTC residents?
It is hard to overstate the broader implications of the NH/LTC Simpson’s Paradox: It completely reorients the trend of mortality in seniors after 2020 from declining excess to increasing or sustained excess, particularly for people ages 60-89. (Yes, 60-64 aren’t technically “seniors”, but since they are affected by this phenomenon they’re included. Besides, if the government and medical establishment can change definitions on the fly wherever it suits them, we can stretch the definition of seniors a bit for legitimate analytical purposes.)
As far as I am aware, every mortality and excess mortality dataset or analysis put out by major or influential people about the pandemic years fails to account for this. (The only exception is Ethical Skeptic, who has a very sophisticated ‘pull-forward effect’ model built into his calculations. And even this is not fully accounting for the Simpson’s Paradox, because he is using aggregated data for the entire country that doesn’t stratify for characteristics like NH/LTC residency.)
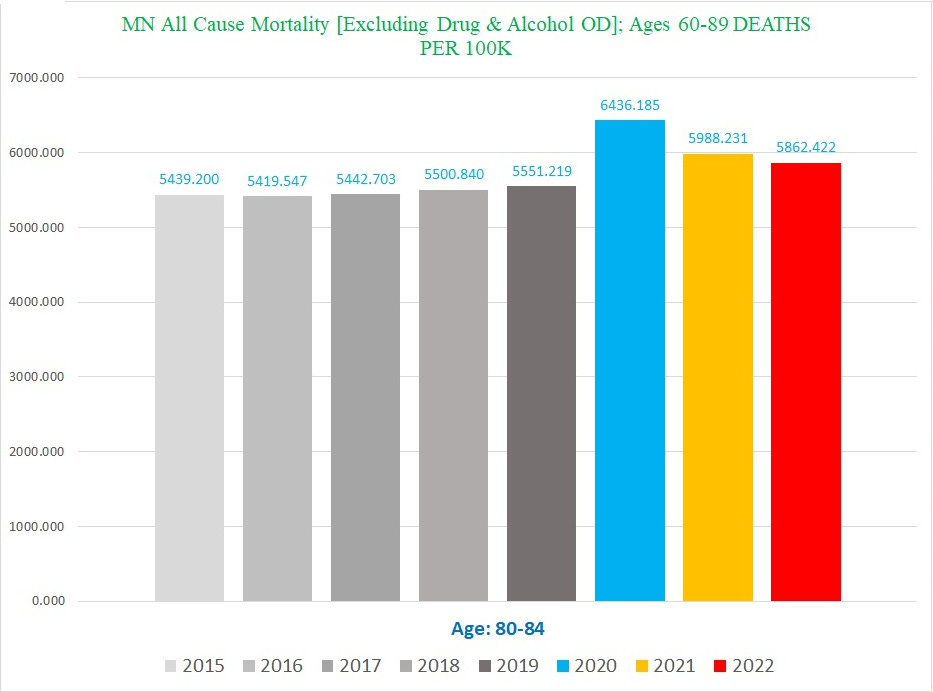
One way to illustrate this is by looking at the number of deaths per 100K people. Since I can’t get a nursing home or LTC resident census, we are stuck using the total population of each age group (curtesy of the Census Bureau’s yearly estimates by 1-year age cohorts).
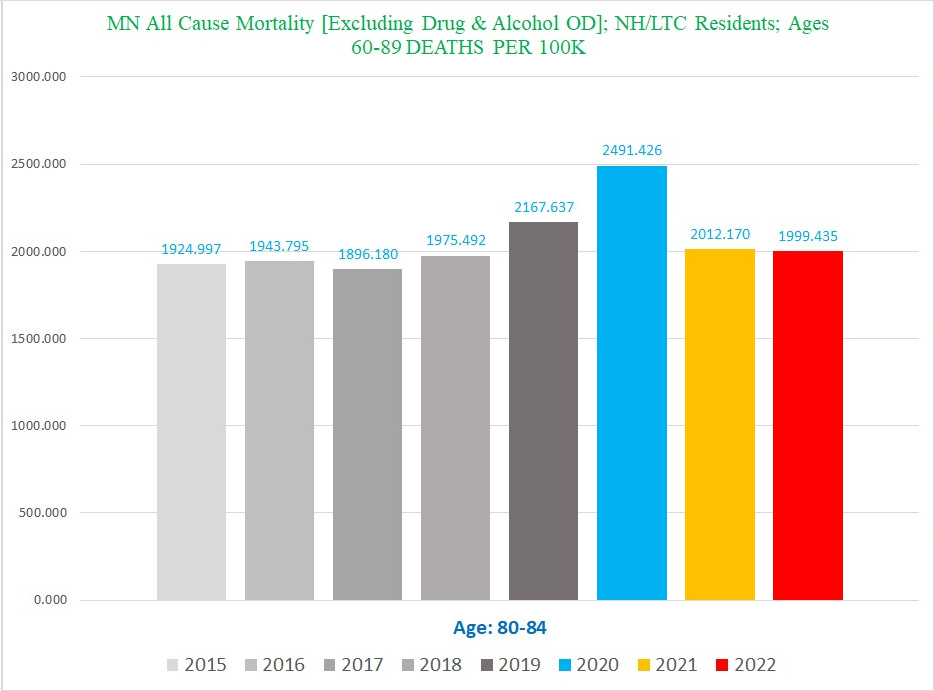
Chart #1: Number of deaths/100K Ages 80-84:
Chart #2: Number of NH/LTC Resident deaths/100K of the *total population* Ages 80-84:
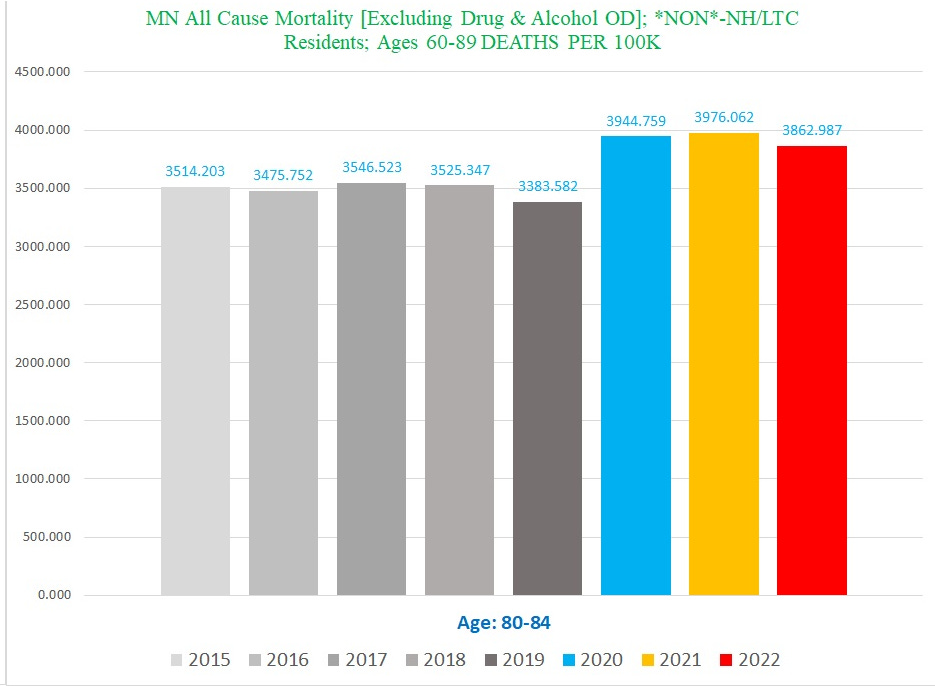
Chart #3: Number of **NON**-NH/LTC Resident deaths/100K of the *total population* Ages 80-84:
The top two charts look nothing like the bottom chart.
The difference between the top chart and the bottom chart gives you an idea of how much the aggregate totals for the entire population of an age cohort conceals the trend of far higher excess mortality in the *NON*-NH/LTC residents after 2020.
This “Simpson’s Paradox” affects a number of individual ICD Code categories too, some more than others.
Critically, this includes major categories that are especially important like cancer.
Cancer
One of the reasons this trend was surprising to me is that it revealed substantial excess mortality for cancer UCoD deaths, even though there is almost no detectable excess in cancer UCoD deaths overall (there seems to be an enterprise to launder cancer deaths out of UCoD into MCoD, including a bunch where covid was assigned by the CDC as the UCoD instead).
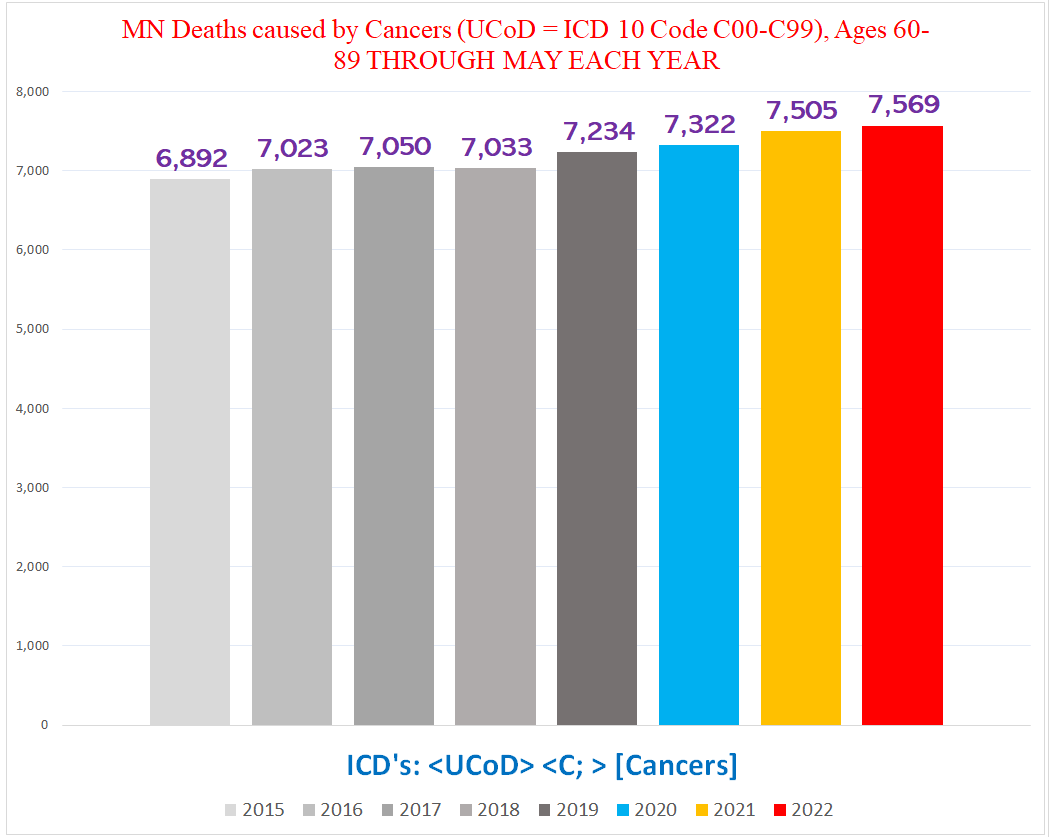
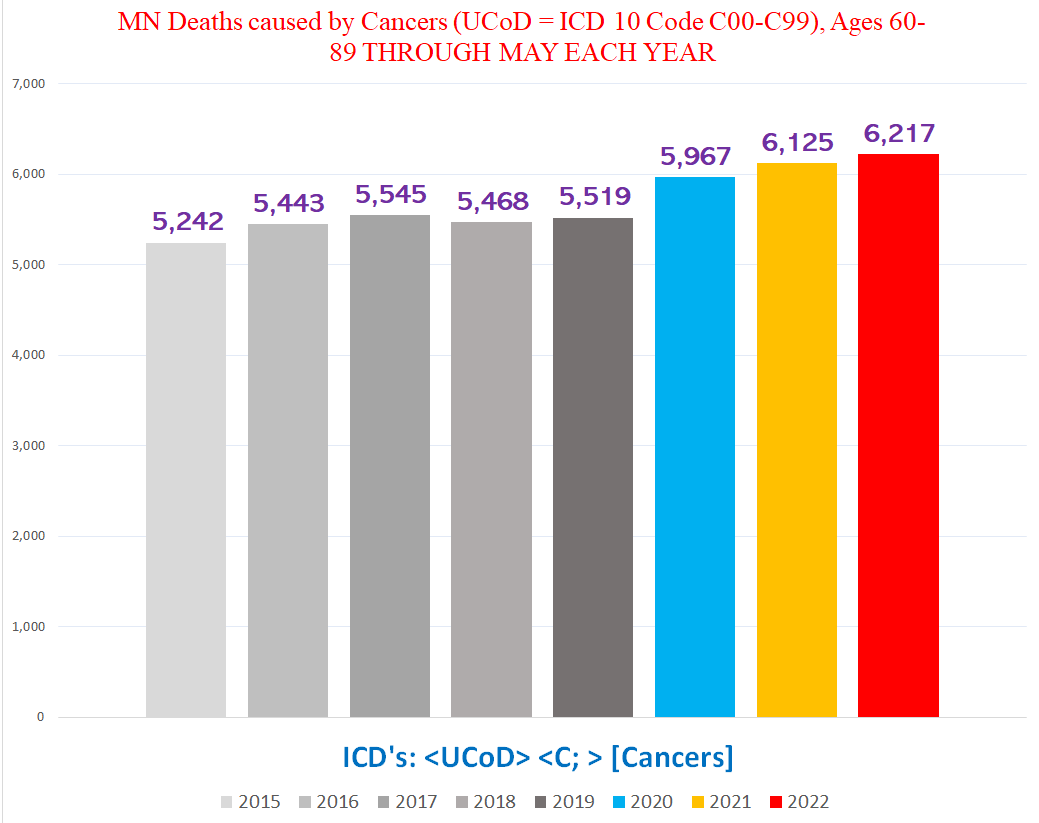
Chart #1 - Total number of deaths where a cancer (ICD codes C00-C99) was the UCoD (Underlying Cause of Death), ages 60-89
The total number of cancer UCoD deaths in the 60-89 yo population shows slight excess mortality. So slight that the increase from 2018 to 2019 (+199) is larger than the increase between any two pandemic years (+88; +183; +64):
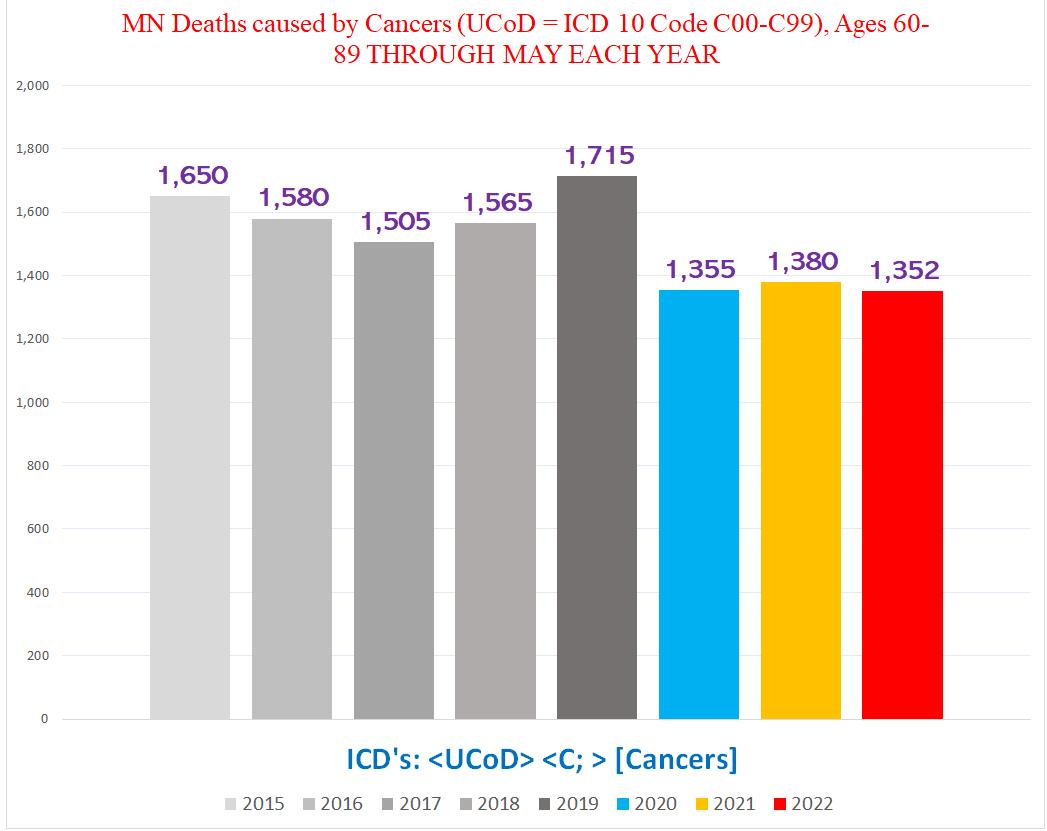
Chart #2 - Total number of deaths where a cancer (ICD codes C00-C99) was the UCoD (Underlying Cause of Death), *Nursing Home / Long Term Care Facility residents* (NH/LTC) ages 60-89:
Here’s the first half of the cancer bombshell - the number of cancer UCoD deaths in *NH/LTC residents* DROPS by 160 from 1,715 such deaths in 2019 to only 1,355 such deaths in 2020, and remains essentially unchanged from that point on:
Chart #3 - Total number of deaths where a cancer (ICD codes C00-C99) was the UCoD (Underlying Cause of Death), ages 60-89 **NOT** NH/LTC RESIDENTS:
This is the second half of the bombshell. As you can see in the chart below, the number of cancer UCoD deaths jumps dramatically WHEN WE LOOK AT DEATHS EXCLUSIVELY IN **NON** NH/LTC RESIDENTS:
You can see how the significant excess mortality documented as primarily caused by cancers is almost completely hidden by combining the NH/LTC residents with the NON-residents.
Diabetes
Here’s one more example (running the queries & creating all these charts is very time-consuming & tedious work, so a more thorough exploration of this subject will have to wait for another article):
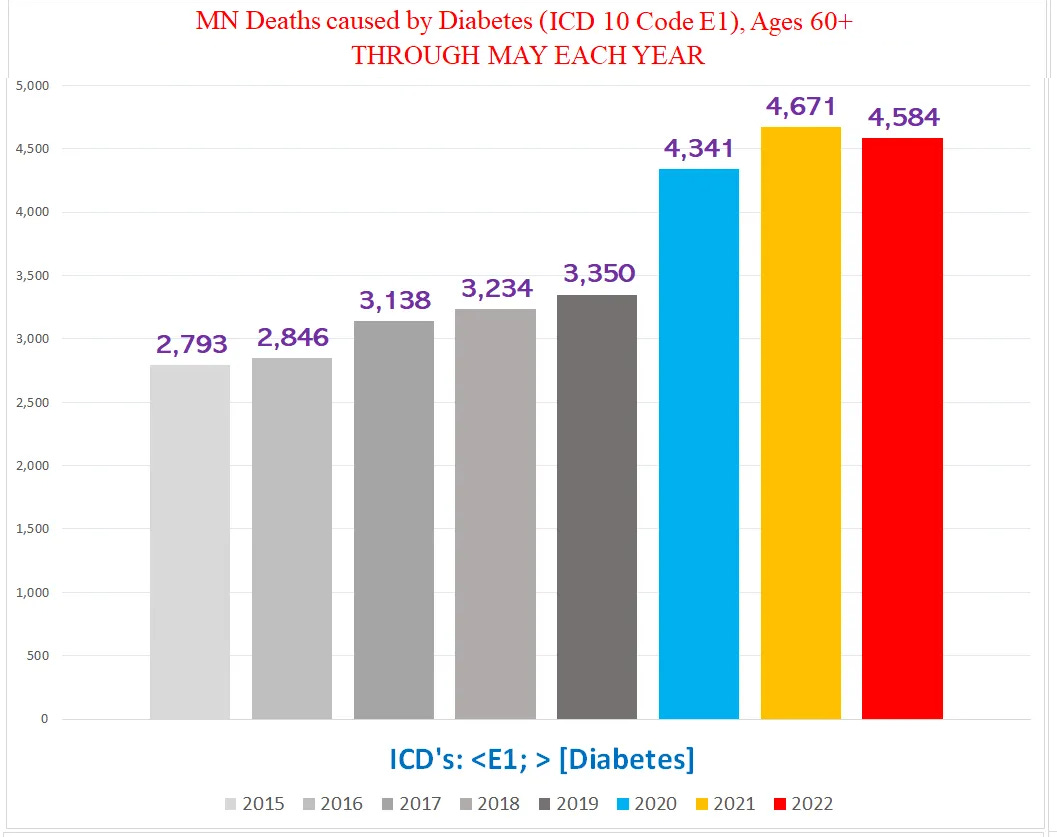
Chart #1 - Total number of deaths with Diabetes (ICD codes E10-E19), Ages 60+
The combined total number of deaths with diabetes decreases in both 2021 & 2022 - notice that the number of deaths goes down year over year after 2020:
Chart #2 - Total number of deaths with Diabetes (ICD codes E10-E19), *Nursing Home / Long Term Care Facility residents* (NH/LTC), Ages 60+
Compare the NH/LTC resident deaths -
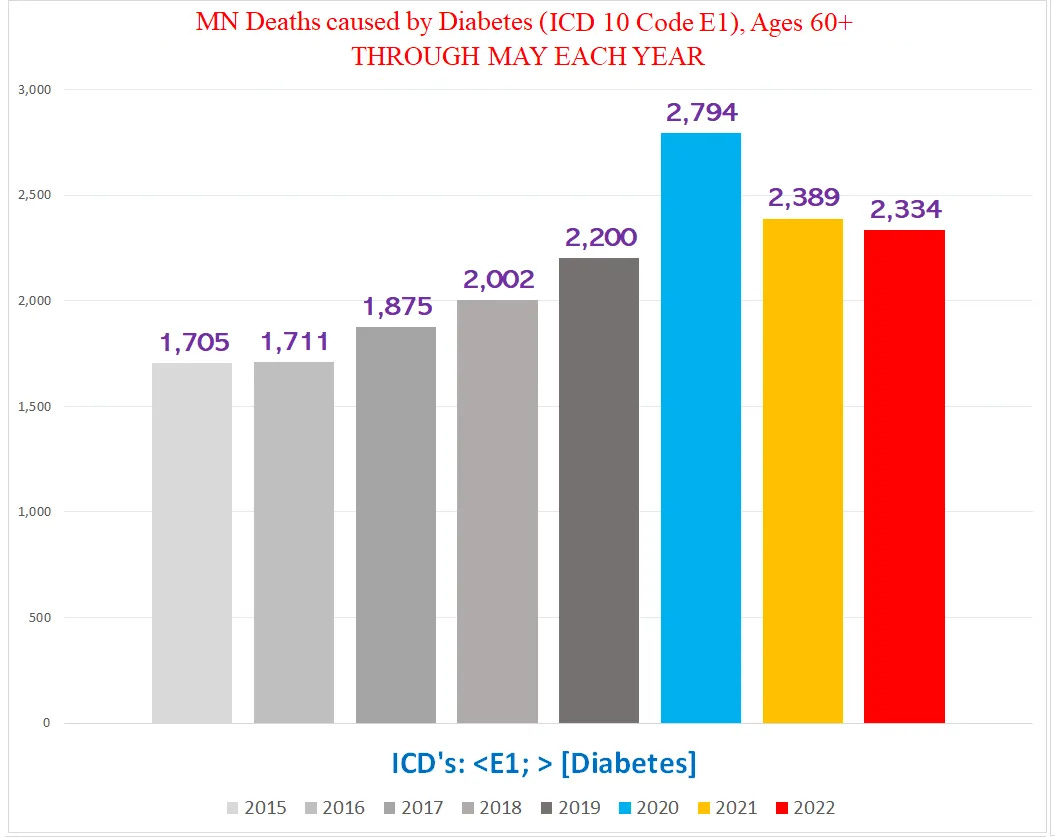
Chart #3 - Total number of deaths with Diabetes (ICD codes E10-E19) , **NOT** NH/LTC RESIDENTS, Ages 60+:
- with the NON-resident deaths:
The difference is quite stark.
One last important stipulation: This article is not addressing any of the other confounders that suppress the degree of excess in mortality data, or how to sort out the attribution of the excess deaths among the various factors all contributing to excess mortality during the pandemic years.


This is a great analysis....scary to think how much other “knowledge” about the impact of the vaccines and lockdowns is also distorted by aggregation.
Very good article and timely as Covid cases are on the rise in the jabbed. They were attending a forum on Covid, all but I think 25 had jabs.